Figure 1.
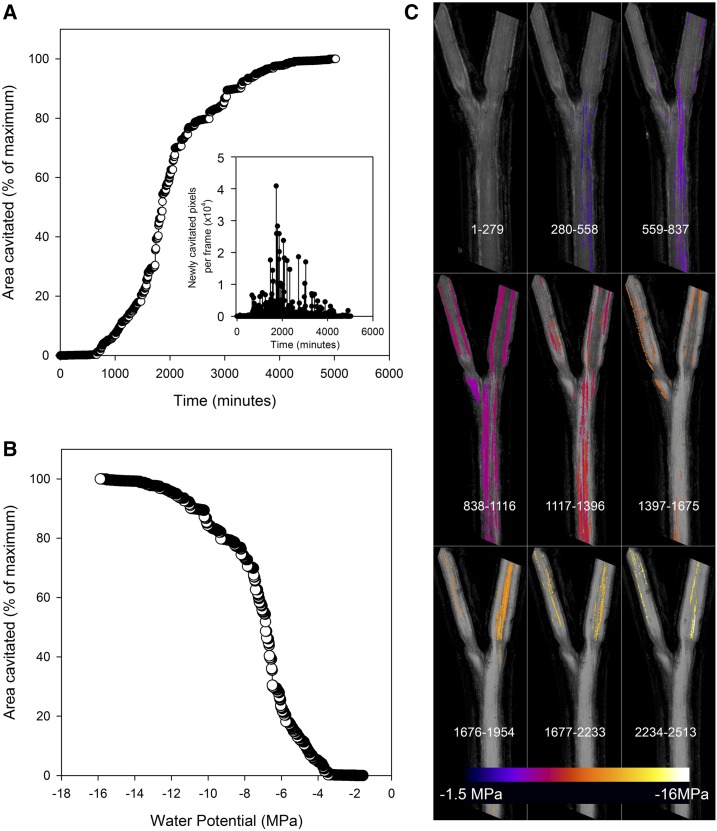
A, A cumulative area of cavitated xylem in a sample stem of Callitris rhomboidea is shown to increase rapidly approximately 1 d after a hydrated branch was excised (time zero) and allowed to dry. After a rapid rise in cavitation, the rate of new xylem cavitated (quantified as the number of pixels) falls back to zero approximately 3 d after excision. The inset graph shows that the size of newly cavitated regions visualized in the stem reaches a maximum during the steepest part of the curve. During this period, very large blocks of tracheids were cavitating in the 2-min interval between scans. B, A cumulative area of cavitated xylem expressed as a function of stem water potential shows a classic sigmoidal vulnerability curve. C, A mosaic of color maps shows the spatial progression of cavitation through time in this 20-mm-long branched sample, the same stem sample as in A and B. Sequential blocks of 280 images have been stacked together (frame numbers are shown at the bottom portion of each tile), with cavitated pixels colored according to the water potential at which cavitation occurred. In this sample, the smaller branches proved to be slightly more resistant to cavitation than the main branch.

