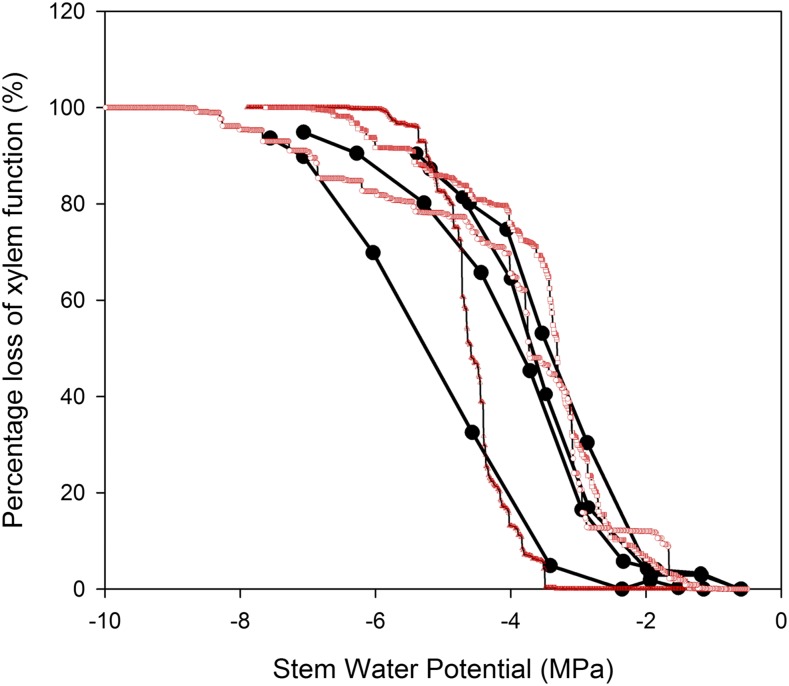
Figure 3.
Comparison of the vulnerability curve shape produced by the cavitron (black circles) and the optical method using branches from the same three individuals of the conifer Lagarostrobos franklinii. Although the mean P50 is very similar in both species, the slope of the curves between 12% and 88% was steeper using the optical method.

