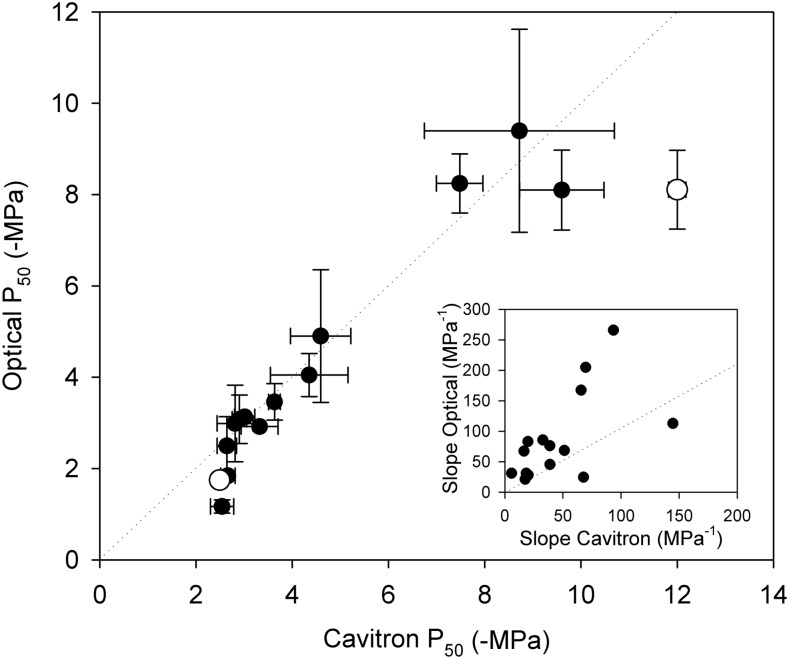
Figure 4.
P50 (means ± sd) for stems of the same individuals measured with the optical and cavitron methods. Very close agreement was found in the conifer sample between methods (regression slope, 0.98; r2 = 0.93). Among the two angiosperms sampled, good agreement was found in one species, while the cavitron method produced a more negative P50 in the second. Slopes produced by the two techniques (inset graph) were correlated (r2 = 0.35; P < 0.05), but the optical technique produced a steeper slope in 14 of 16 species (1:1 is shown as a dotted line in each plot).

