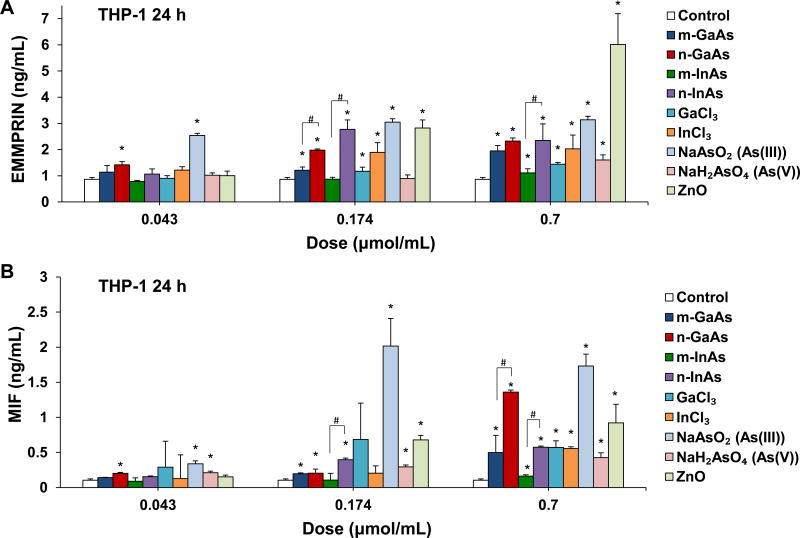
Figure 3.
Comparative effects on EMMPRIN and MIF production in THP-1, following exposure to particulate and ionic III-V materials at 0.043, 0.174 and 0.7 µmol/mL for 24 h. The corresponding mass doses were listed in Table 3. ZnO NPs were used as a positive control. EMMPRIN (A) and MIF (B) levels were assessed in the cell culture supernatant by ELISA. (*) p < 0.05 compared to control. (#) p < 0.05 compared to nano-sized III-V particles.

