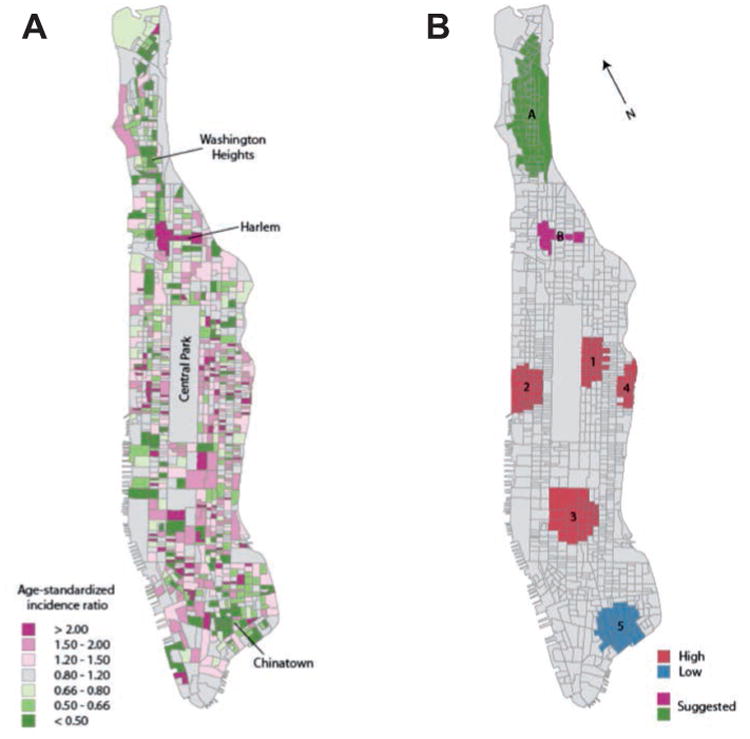
Figure 2.

Breast cancer incidence, Manhattan, 2005-2009. Standardised incidence ratios (A) and by block group (B). Clusters as defined by the spatial scan statistic (red and blue) and other areas of interest suggested by the signal intensity ratio map (magenta and green).
