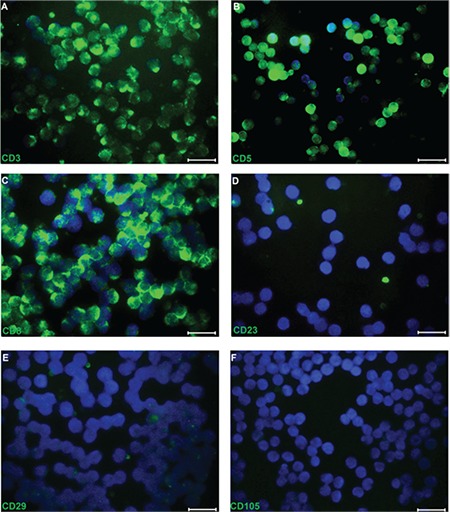
Figure 3. Representative panels of immunofluorescence in phytohemagglutinin (PHA)-CD3+ T cells. Fluorescence microscopy analysis of the expression of cell surface markers staining for CD3 (A), CD5 (B), and CD8 (C) was positive whereas it was negative for CD23 (D), CD29 (E), and CD105 (F) in PHA-CD3+ T cells (scale bars=50 µm).

