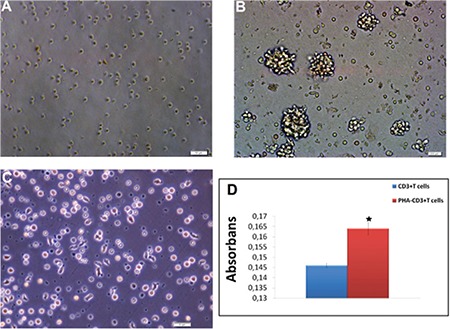
Figure 4. Activation of CD3+ T cells by phytohemagglutinin (PHA). Phase-contrast microscopy showing that as CD3+ T cells (A) were activated by PHA-M for 24 h, the morphologies and shapes of the cells changed, and they presented extensions (B, C). Activation of CD3+ T cells (by PHA) was determined by WST-1 (D). Increased levels of proliferation (of PHA-CD3+ T cells) were determined by WST-1 (n=3, mean ± SE, p<0.05). Activation of CD3+ T cells (by PHA) was determined by flow cytometer.

