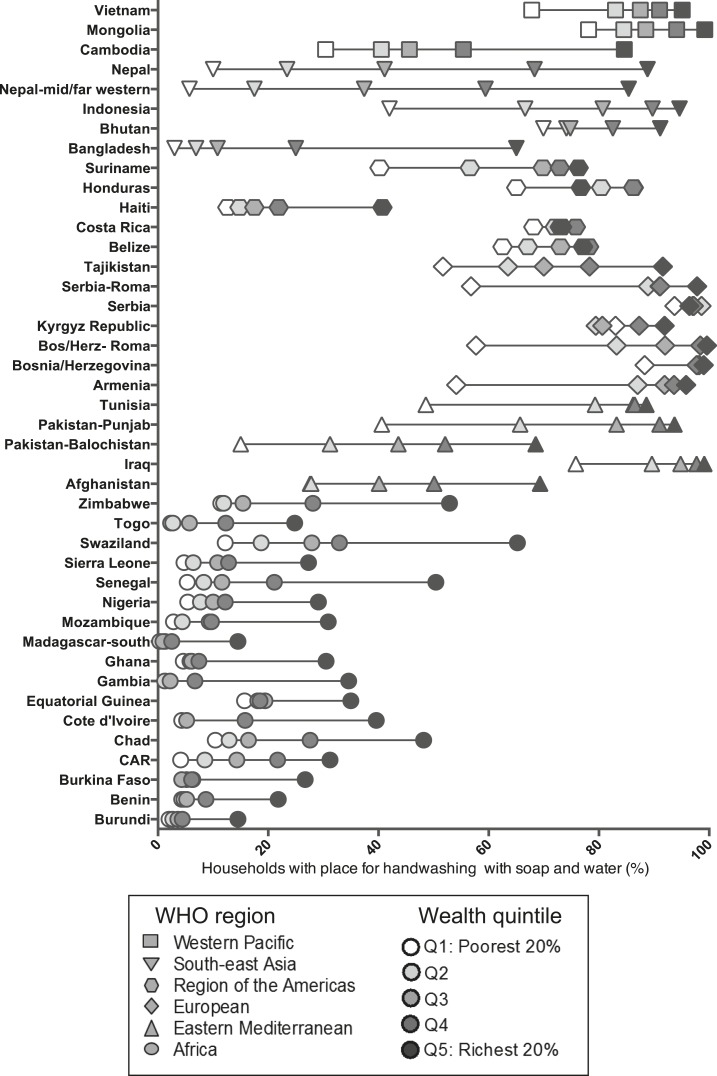
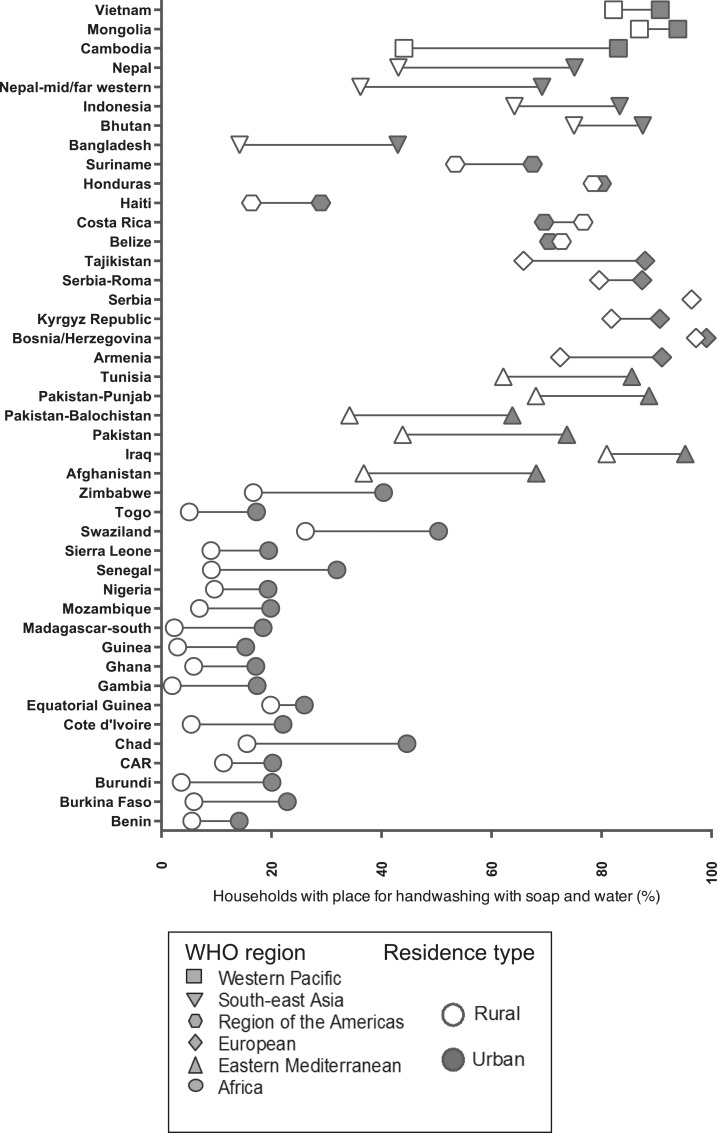
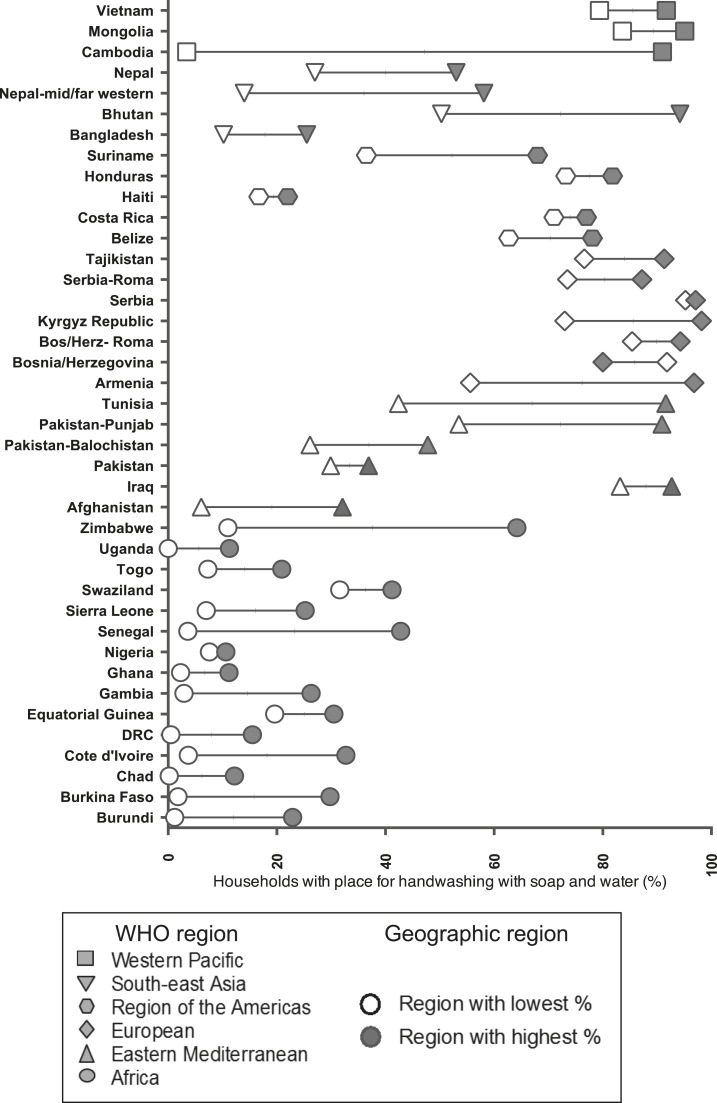
Figure 4.
(A) Percentage of households observed to have handwashing place with soap and water, by wealth quintile, Multiple Indicator Cluster Surveys (MICS) and Demographic and Health Surveys (DHS), 2010–2013. (B) Percentage of households observed to have handwashing place with soap and water, by residence type, MICS and DHS, 2009–2013. (C) Geographic regions with highest and lowest percentage of households observed to have handwashing place with soap and water, MICS and DHS, 2009–2013.


