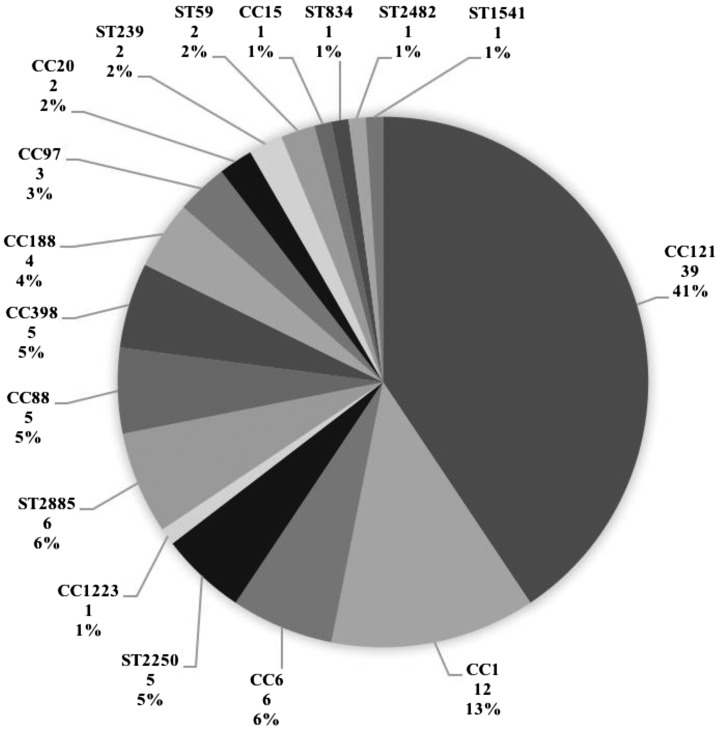
Figure 1.
Staphylococcus aureus lineage distribution by microarray for all isolates (N = 96). CC, clonal complex; ST, multilocus sequence type; MSSA, methicillin-sensitive Staphylococcus aureus; MRSA, methicillin-resistant S. aureus. The number under each lineage label denotes the number of study isolates belonging to the lineage and the percentage denotes the representation of the lineage as a percentage of the total number of study isolates analyzed.

