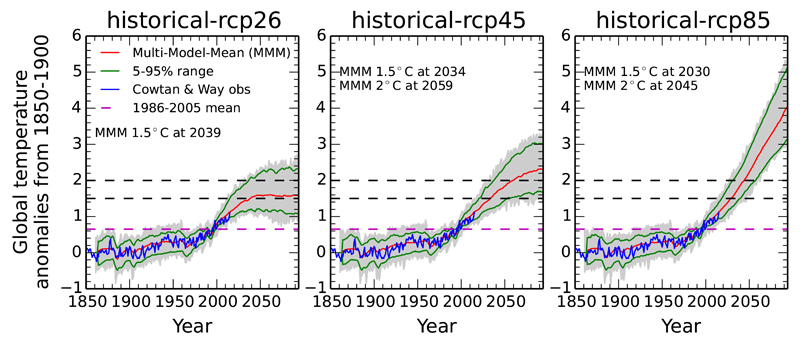
Fig 1. Historical data and future projections for global mean temperature.
Annual global mean temperature for observations17 (blue) and model simulation range (grey), anomalies first calculated for 1986-2005 and then observed warming since 1850-1900 (0.6517 – purple dashed line) has been added. Model mean (red) and 5-95% range (green) of the probability distribution from the model simulations smoothed by a 5-year running mean for 3 different future scenarios. Year when the median of the model distribution relative to 1850-1900 crosses the 1.5°C and 2°C thresholds are given in text.

