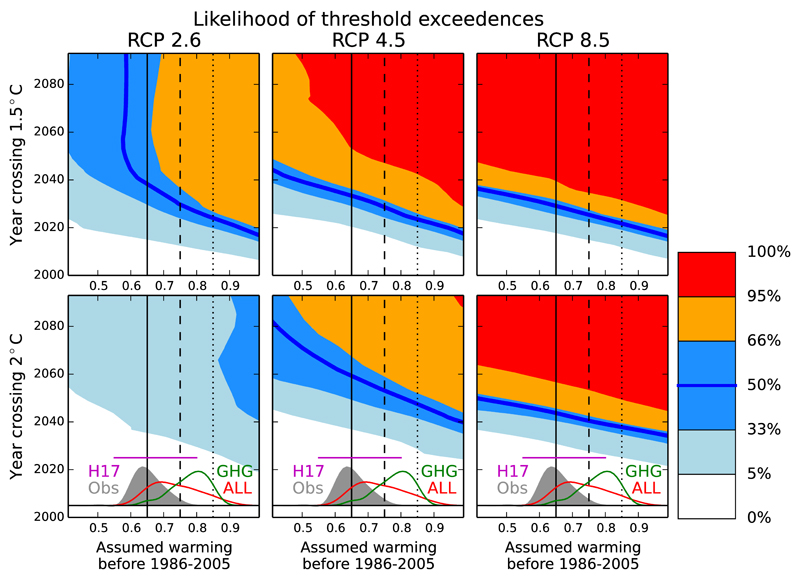
Fig 3. Probability of exceeding temperature threshold for different assumed preindustrial baselines.
Probabilities for exceeding a particular global mean temperature threshold in any given year are given [%], smoothed by a 30-year Lowess filter for clarity (un-filtered version in supplement). Vertical lines indicate assumed pre-instrumental warming of 0°C relative to 1850-1900 (solid), 0.1°C (dashed) and 0.2°C (dotted). Distributions in bottom panels show uncertainty in the observational estimate of warming from 1850-1900 to 1986-2005 (grey) and model distributions of 100 year mean temperatures in periods prior to 1800 relative to the 1850-1900 mean added to the mean warming from 1850-1900 to 1986-2005, using ALL forcings (red) and GHG forcings only (green), the purple line shows the equivalent 1720-1800 temperature range estimated by Hawkins et al8.

