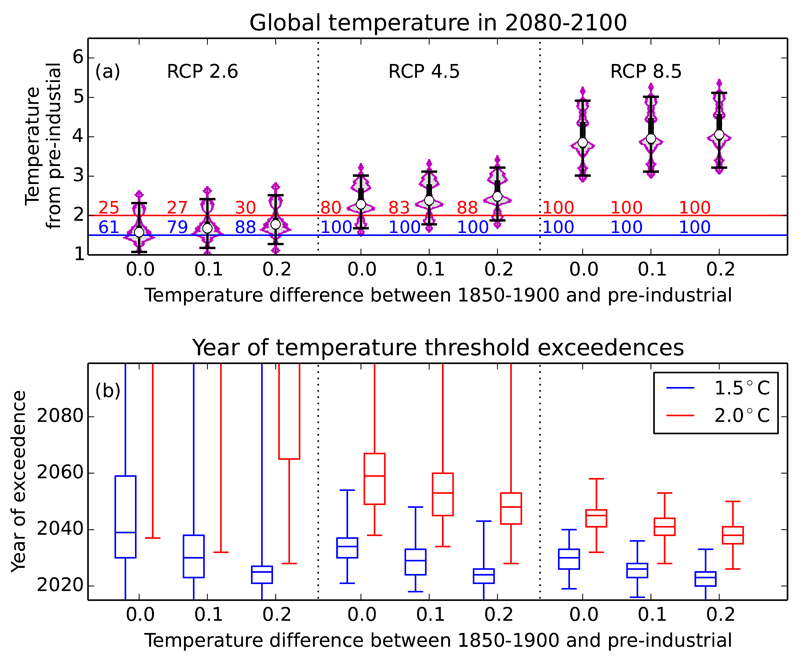
Figure 4. Probability distributions for mean temperatures and time of threshold exceedance.
a) Model temperature projections. Model distribution (violin plot, purple line), 33-66% range (thick black line) 5-95% range (whiskers) and median value (white circle). Text gives probability of exceeding 1.5°C (blue) and 2°C (red), b) Probability of threshold crossing year for 1.5°C (blue) and 2°C (red). 5-95% range (whiskers), 33-66% range (box) and median value (horizontal line).

