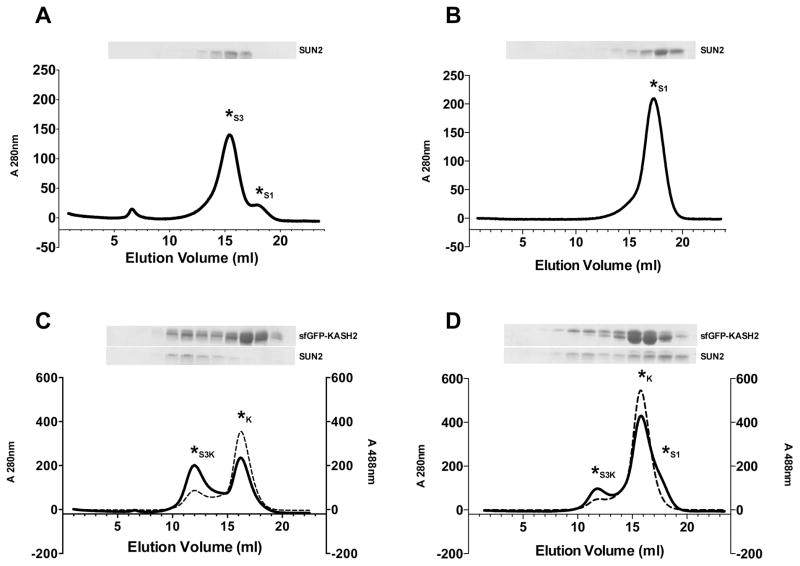
Figure 3.
In vitro SUN-KASH binding experiments. SUN-KASH binding was analyzed by gel filtration on a Superdex S200 HR10/300 column. Each panel shows a representative gel filtration profile and corresponding SDS-PAGE as follows: (A) Apo-SUN2 in buffer 1. (B) Apo-SUN2 in buffer 2. (C) Apo-SUN2 and sfGFP-KASH2 in buffer 1. (D) Apo-SUN2 and sfGFP-KASH2 in buffer 2. Asterisks are used to mark each peak, denoting the SUN2 monomer peak as S1, the SUN2 trimer as S3, the SUN2 trimer bound to sfGFP-KASH2 as S3K, and unbound sfGFP-KASH2 as K. Solid lines on each chromatogram represent the 280 nm trace; dashed lines represent the 488 nm trace. Buffer 1 contains 20 mM HEPES pH 8.0 and 100 mM KCl. Buffer 2 contains 10 mM Tris/HCl pH 8.0, 150 mM NaCl and 1 mM KCl. Each Coomassie-stained SDS-PAGE gel shows 1 ml fractions covering the 7–18 ml elution segment. SUN oligomerization is buffer-dependent. Buffers that enable SUN trimerization are required for SUN-KASH binding experiments.

