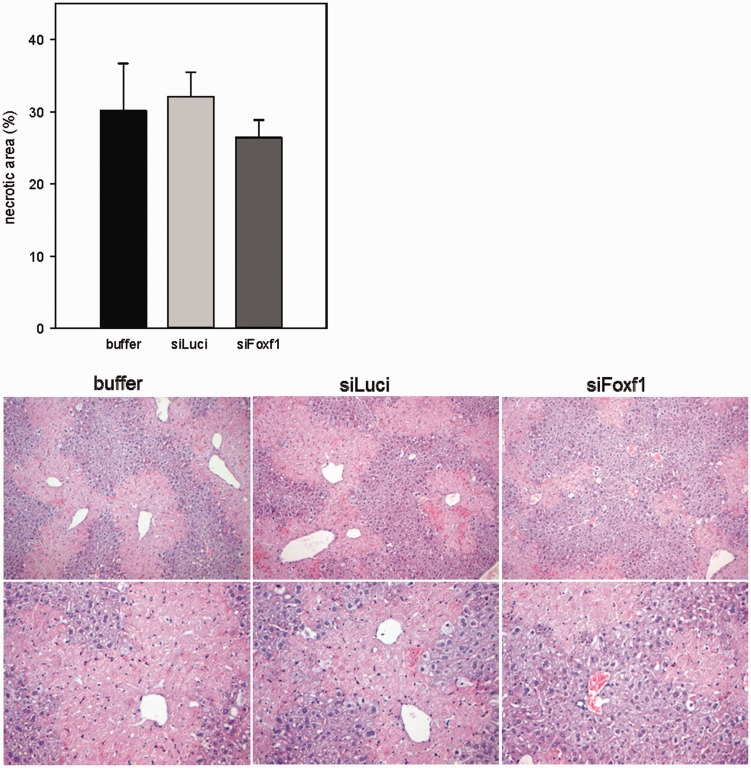
Figure 3.
Quantification of necrotic area on H&E stained liver sections in buffer- and siRNA-treated mice with acute liver damage and representative images of H&E staining (original magnification 200 × (upper panel) and 400 × (lower panel)) (n = 5–9 per group). Values are given as means ± SEM (A color version of this figure is available in the online journal.)

