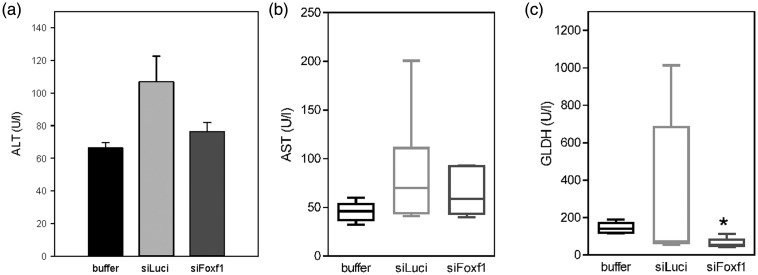
Figure 6.
Analysis of plasma activities of aspartate aminotransferase (AST) (a), alanine aminotransferase (ALT) (b) and glutamate dehydrogenase (GLDH) (c) upon chronic CCl4 administration in buffer- and siRNA-treated mice (n = 5–7 per group). Values are given as means ± SEM (ALT) or as box plots indicating the median, the interquartile range in form of a box, and the 10th and 90th percentiles as whiskers (AST, GLDH). Significance of differences between the groups was tested by One way ANOVA on Ranks (*p < 0.05 vs. buffer)

