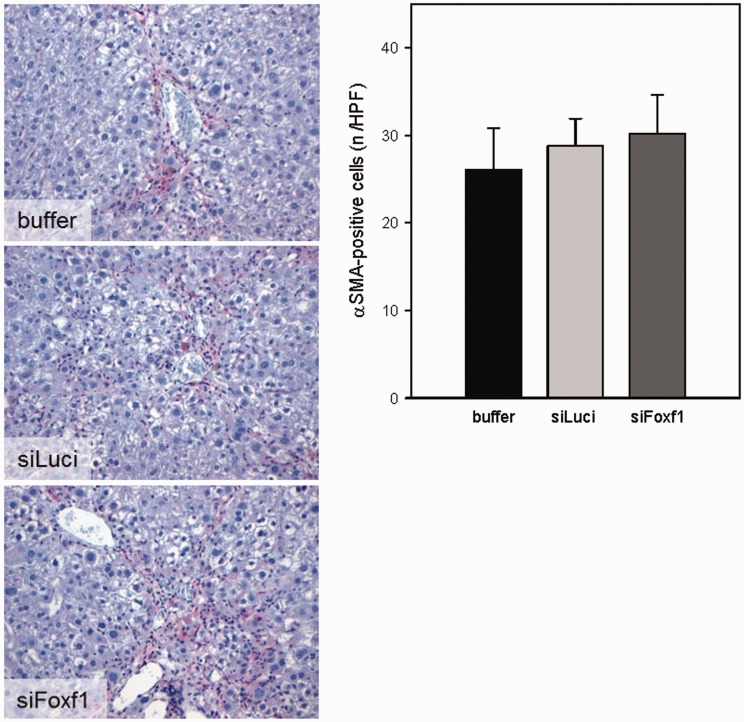
Figure 7.
Representative images of immunohistochemical αSMA staining and quantification of αSMA-positive cells on liver sections of buffer- and siRNA-treated mice upon chronic CCl4 administration (original magnification 400×) (n = 5–7 per group). Values are given as means ± SEM (A color version of this figure is available in the online journal.)

