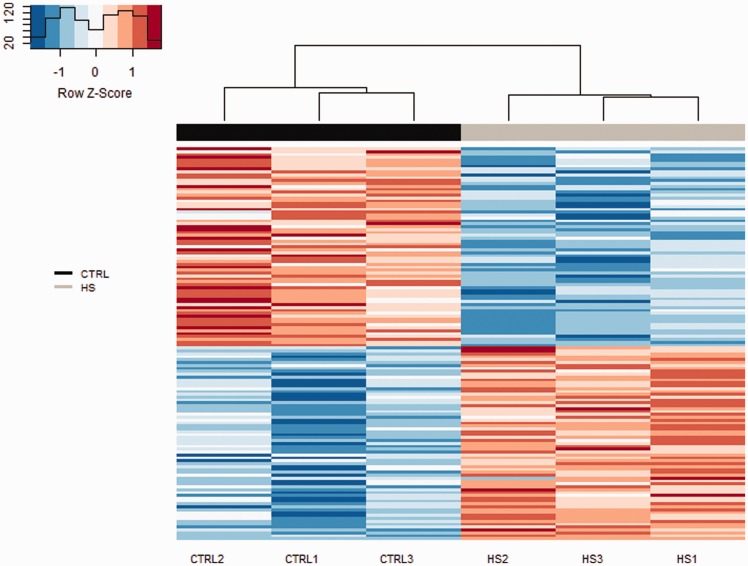
Figure 3.
Heatmap of gene expression for 136 genes differentially expressed between HS and CTRL rats. Each column represents an animal (CTRL and HS), with animals clustered by similarity using a hierarchical clustering. The gene expression level is represented by a color scale gradient ranging from blue (lower expression) to red (higher expression) (A color version of this figure is available in the online journal.)

