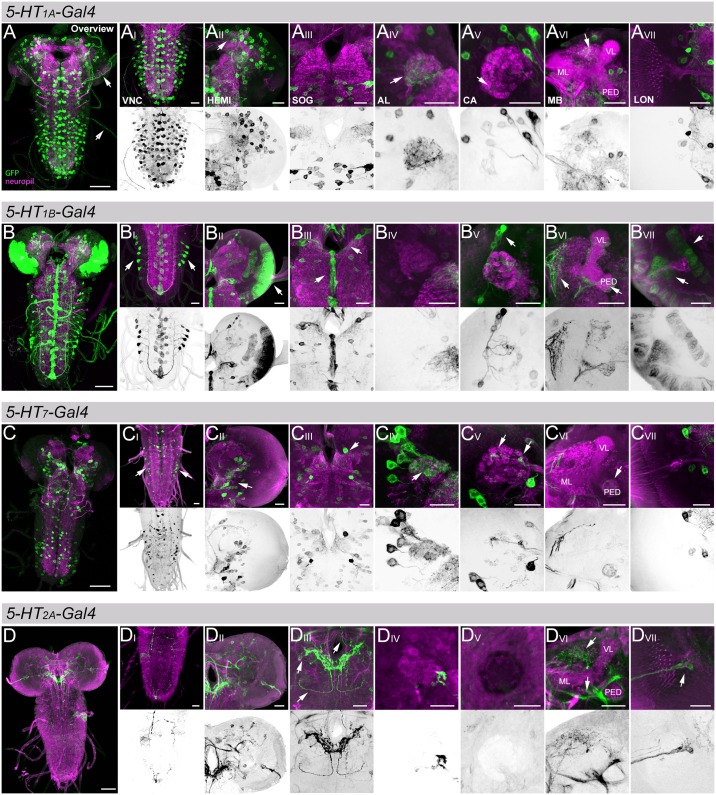
Fig 1. Gal4 expression patterns of four potential 5-HT receptor lines.
5-HT1A-, 5-HT1B-, 5-HT7-, and 5-HT2A-Gal4 positive cells are shown in A, B, C, and D, respectively. (A-C) Gal4 lines were crossed with UAS-mCD8::GFP to analyze their expression patterns (green; anti-GFP staining) in addition to reference labeling of the central nervous system (CNS) (magenta; anti-ChAT/anti-FasII double-staining). In (D) 5-HT2A-Gal4 was crossed with UAS-myr::tomato to visualize its expression pattern (green; anti-dsRed staining) within the larval CNS (magenta; anti-ChAT/anti-FasII double-staining). For all four lines the first column shows a frontal view onto a z-projection of the entire CNS. In addition, for each line representative z-projections of close-ups of the ventral nerve cord (VNC), one hemisphere (HEMI), the suboesophageal ganglion (SOG), one antennal lobe (AL), the calyx (CA) of the mushroom body (MB), the lobes of the MB, and the larval optic neuropil (LON) are shown from left to right. Below each close-up only the GFP channel is shown as an inverted black and white image to visualize innervation patterns with higher contrast and no neuropil background. White arrows highlight aspects of the expression patterns that are further described in the results. Additional abbrevations: VL vertical lobe, ML medial lobe, PED peduncle; Scale bars: 50 μm (in A, B, C, D) and 20 μm (in all other panels).

