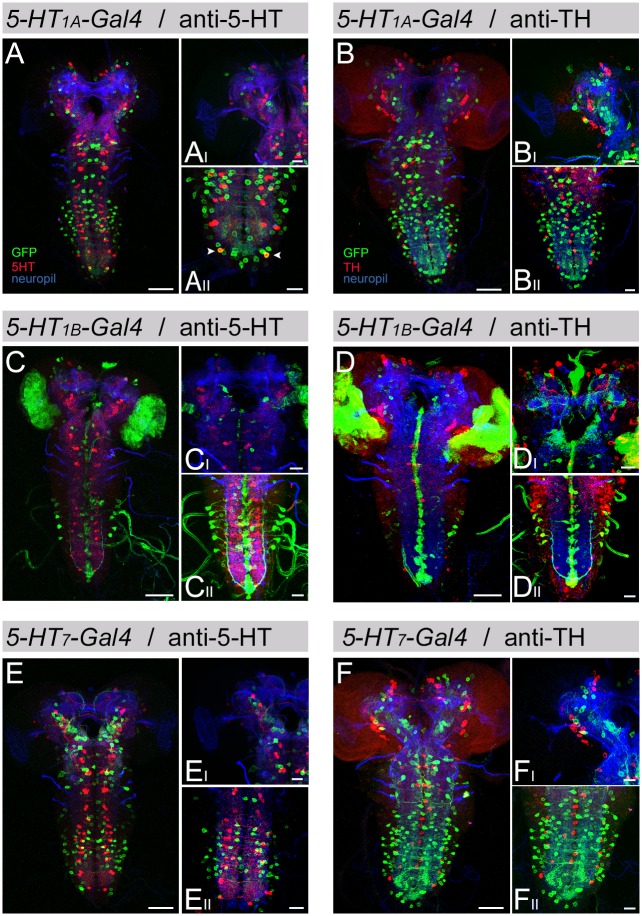
Fig 2. Co-expression of 5-HT1A-, 5-HT1B-, and 5-HT7-Gal4 with anti-5-HT and anti-TH.
Expression patterns of 5-HT1A-, 5-HT1B-, and 5-HT7-Gal4 crossed with UAS-mCD8::GFP are visualized using a triple staining protocol. Anti-GFP (green) was used to label Gal4 positive cells, anti-ChAT/anti-FasII (blue) was used as a reference labeling for the CNS, and anti-5-HT (red, in A, C, E) or anti-TH (red, in B, D, F) was used to identify 5-HT or dopaminergic cells, respectively. 5-HT2A-Gal4 was not included in this experiment due to the low number of cell bodies inside the CNS (Fig 1D). There was no co-staining detected between 5-HT receptor Gal4 expression patterns and anti-TH (B, D, F). The same is true for the co-expression analysis with anti-5-HT (A, C, E); the only exception was a single pair of neurons in the terminal segment of the VNC labeled by 5-HT1A-Gal4 (arrowhead in AII). (A-F) show frontal views onto z-projections of the entire CNS (left) and representative z-projections of close-ups of one or both hemispheres and SOG (right top) and abdominal ganglion (right bottom). Scale bars: 50 μm (left) and 20 μm (right top and bottom).

