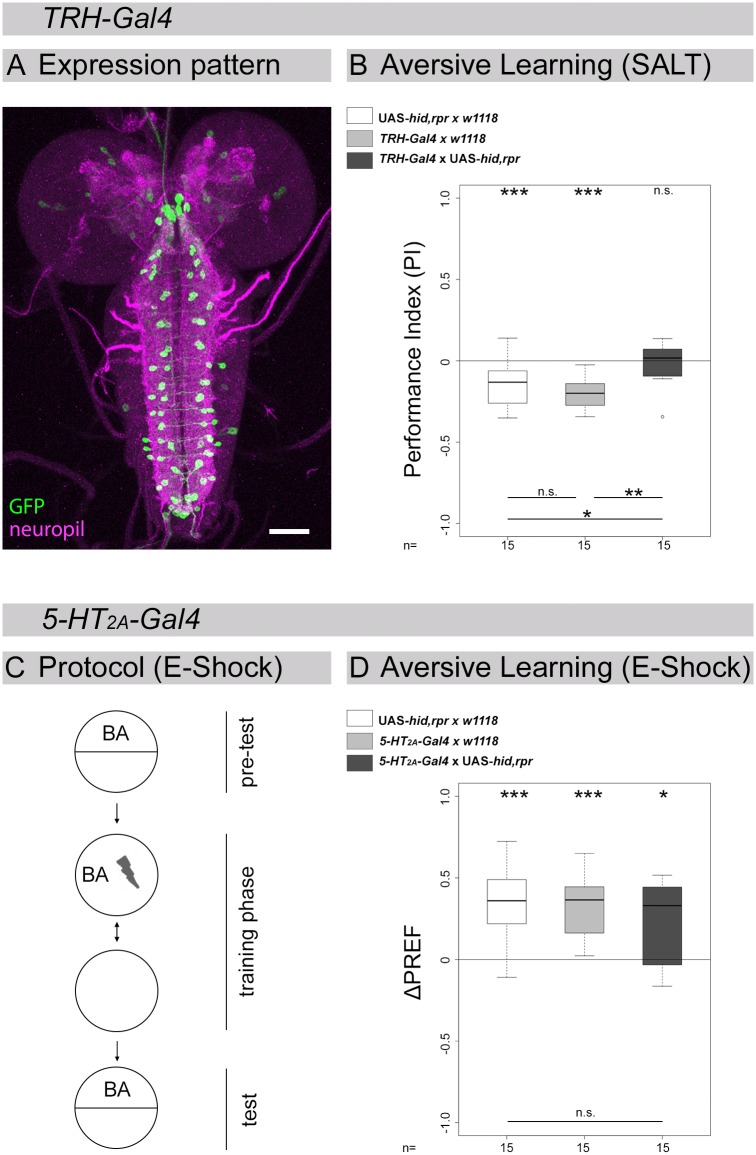
Fig 5. 5-HT/5-HT2A signaling throughout development specifically impairs odor-salt learning and memory.
(A) The TRH-Gal4 line was crossed with UAS-mCD8::GFP to visualize its expression pattern (green; anti-GFP staining) in addition to a reference labeling of the CNS (magenta; anti-ChAT/anti-FasII double-staining). (B) The TRH-Gal4 line was crossed with UAS-hid,rpr to genetically induce apoptosis in 5-HT cells. In addition, the Gal4 line and UAS-hid,rpr were crossed with w1118 to obtain heterozygous genetic control larvae. Above the panel a color scheme describes the three different groups used in the experiment. Ablation of 5-HT cells completely abolished aversive olfactory learning and memory reinforced by high salt concentration. (C) shows an overview on the experimental procedure that was used in larvae to test for odor-electric shock learning and memory. (D) Ablation of 5-HT2A-Gal4 positive cells via UAS-hid,rpr did not impair odor-electric shock learning and memory. Sample size (n = 15) is indicated at the bottom of each box plot. Differences against zero are given at the top of each box plot. Differences between the groups are shown at the bottom of the panel. Visualization of statistical evaluations: if only n.s. is shown the initial KWT did not suggest for a difference between the three groups (p > 0.05). When differences between each group are shown this provides the results of the BWRT as the initial KWT suggested for significance (p < 0.05). *** (p < 0.001), ** (p < 0.01), * (p < 0.05), n.s. (not significant p ≥ 0.05). Scale bar: 50 μm.

