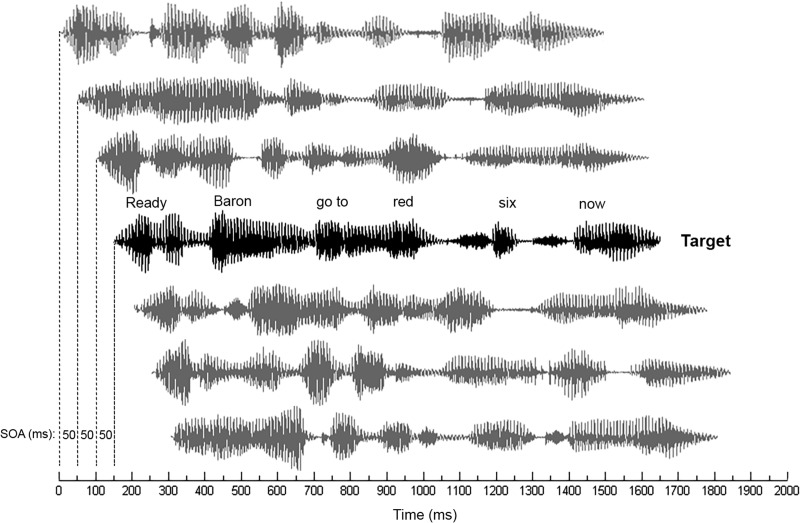
Figure 2.
Schematic illustration of the target and competing CRM stimuli in the six-talkers competition for Experiment I. The target sentence is shown in black, and each of the competing sentences is shown in gray. In this illustration, there is a 50-ms stimulus onset asynchrony (SOA) between all sentences. For the 150-ms asynchrony, only the competing sentences immediately preceding and following the target sentence had this SOA.

