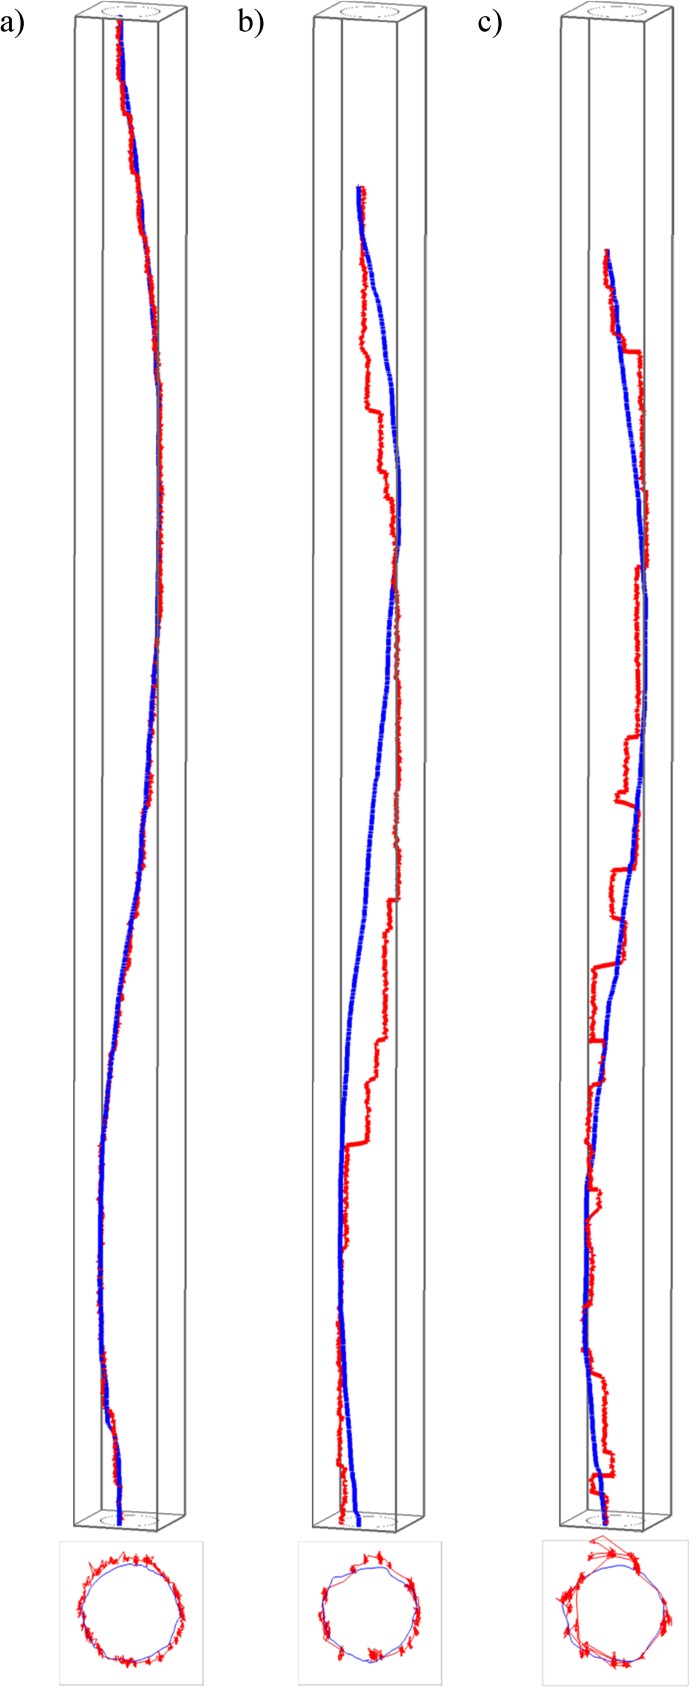
Fig 3. Differences in eye-mouse behaviour across the three tasks.
A) task 1, b) task 2, c) task 3. Gaze and mouse trajectories of an example participant (no. 9) are first shown in an STC in red and blue respectively and at the same temporal scale (note the larger differences between eye and mouse for tasks 2 and 3, which require conscious intervention to both hand and eye movement). The lower image in each subpanel is a view from above, that is, a projection of trajectories onto the 2D space of movement.

