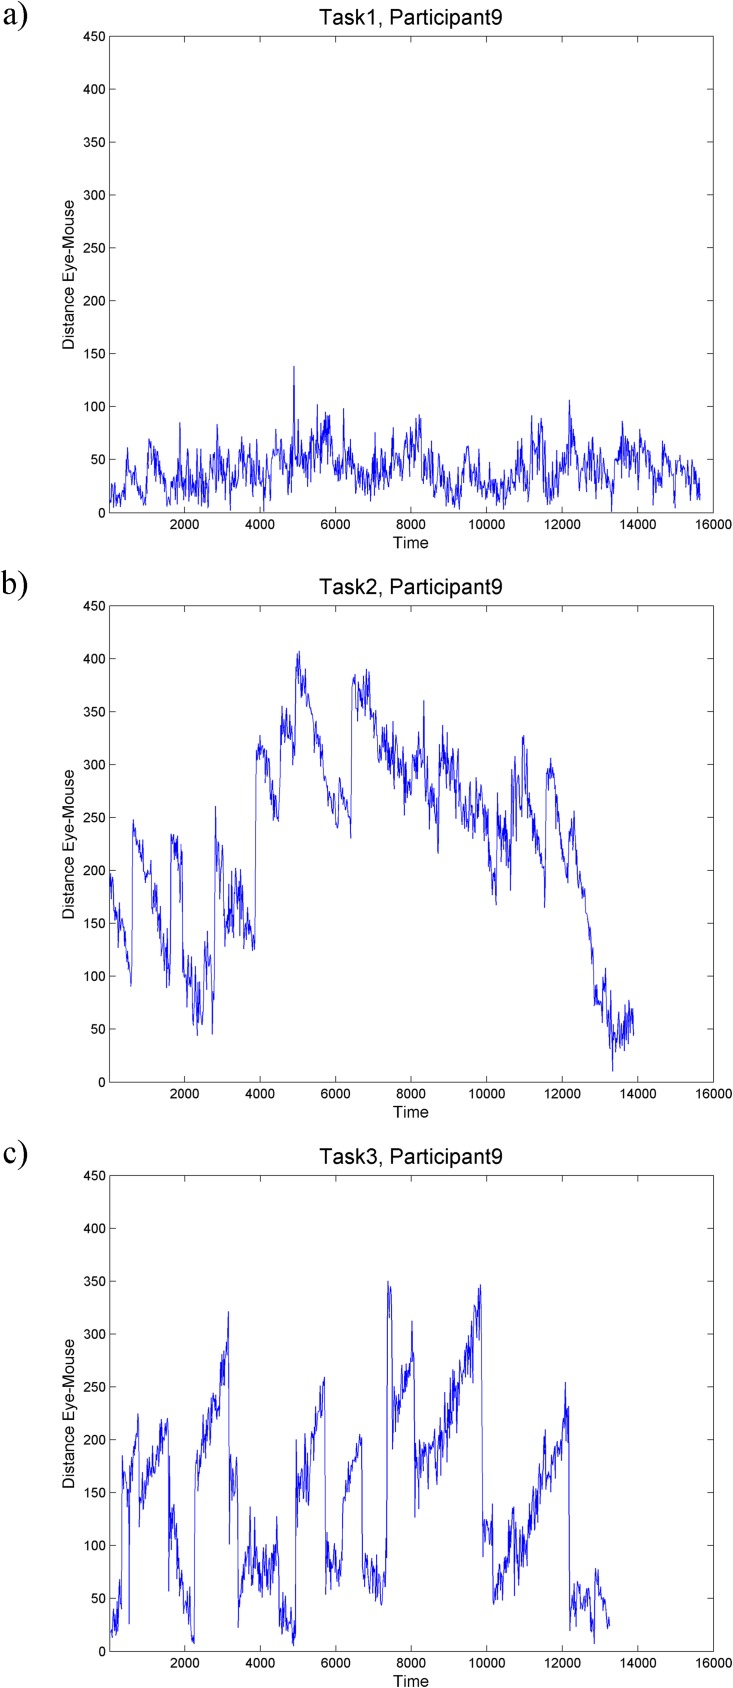
Fig 4. Time series plots of eye-mouse distance.
The same participant (no.9) [as in Fig 3] executing the three tasks: a) task 1, b) task 2, c) task 3. For comparison, plots are shown at the same temporal (x axis shows time) and spatial (y axis shows distance) scales.

