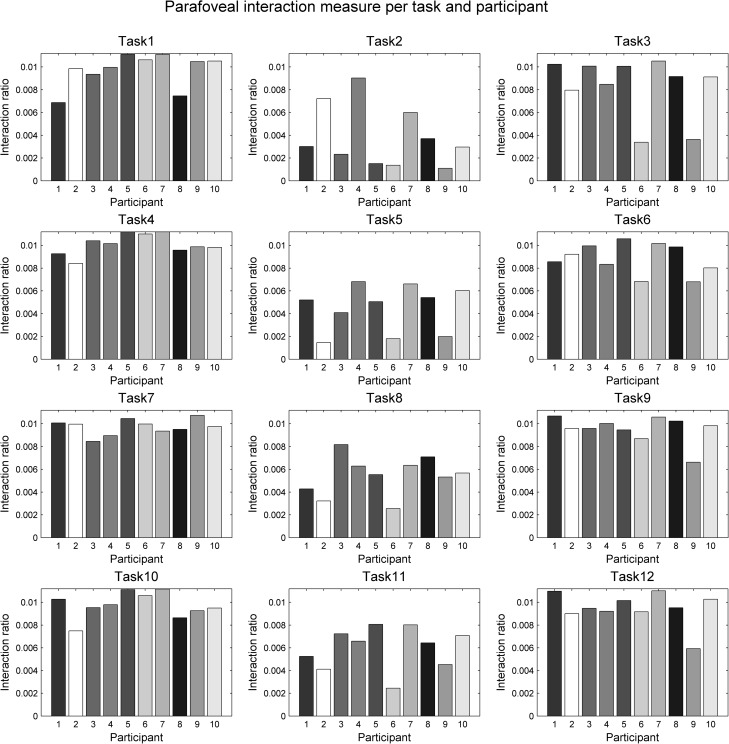
Fig 15. Quantifying parafoveal interaction.
Plots are shown for tracing the circle (tasks 1–3), the rectangle (tasks 4–6), the curve (tasks 7–9) and the star (tasks 10–12). Each row shows three charts: for natural tracing, for eye-first and for mouse-first. Participants are ordered in the same way across all charts and all charts are shown at the same scale, to allow for visual comparison of charts across each geometric form (per row) and across each participant (per each bar in each chart). Bars are coloured per participant in this and the previous figure (foveal interaction).

