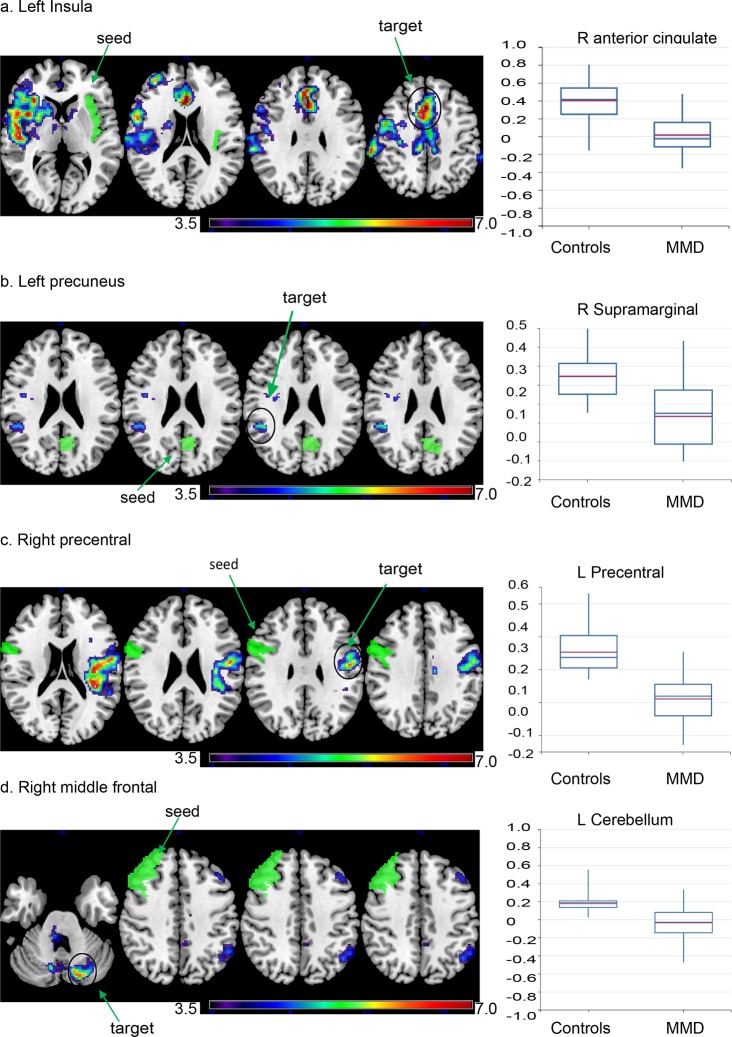
Fig 2. Decreased temporal correlations of low-frequency BOLD signals are present within regions comprising resting-state networks.
Seed regions were selected based on a whole-brain voxel-based analysis and are depicted in green. Voxels that display significant changes in connectivity with the left insula (a), left precuneus (b), right precentral (c), and right middle frontal gyrus (d) are demonstrated (explorative voxel-level threshold at p < 0.001 and FWE-corrected at cluster level p < 0.05). The color bar indicates the Fisher-transformed Z score of between-group differences. Box plots indicate the Fisher-transformed Z score of each group in clusters showing the greatest changes. Resting state networks corresponding to each seed region are demonstrated as a reference. Maps represents salience, default mode, motor, and executive networks generated through independent component analysis in healthy controls.

