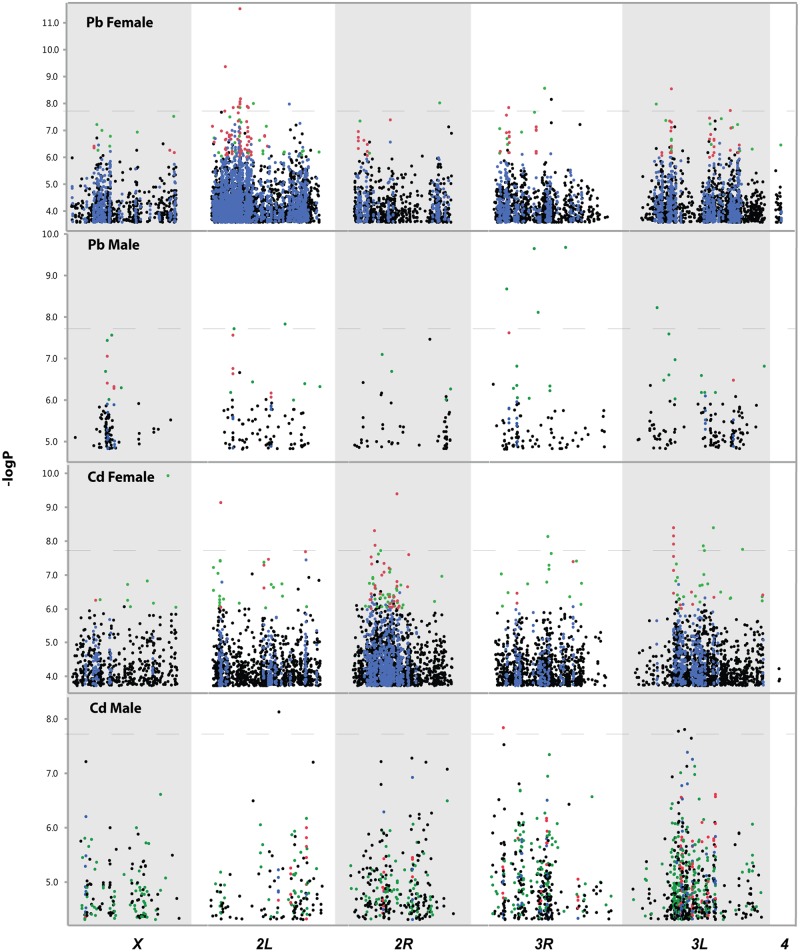
Fig 2. Extreme QTL mapping for variation in resistance to lead and cadmium exposure of adult flies.
Manhattan plots show all SNPs significantly associated with resistance to lead or cadmium exposure at FDR<0.05. The X-axis designates the chromosomal arms of the Drosophila genome. SNPs are color coded. Blue dots indicate SNPs in or near a gene that harbors multiple significant SNPs (≥5), green dots indicate SNPs with large allele frequency differences between the resistant population and the control population (≥2 fold), and red dots indicate SNPs with large allele frequency differences in or near a gene that harbors multiple significant SNPs(≥5). The horizontal dashed lines indicate the Bonferroni-corrected threshold for statistical significance.

