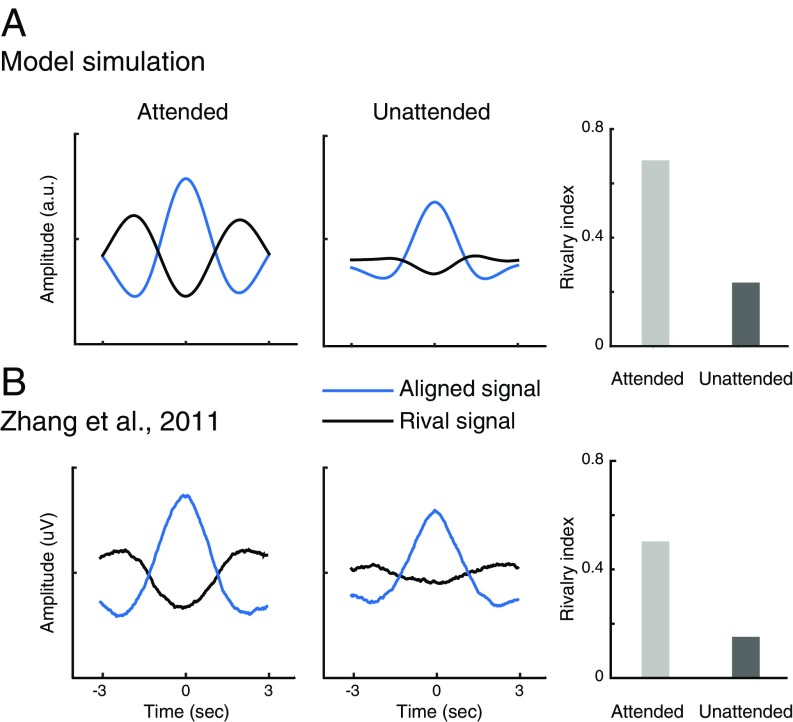
Fig. 3.
Dynamics of binocular rivalry depends on attention: EEG measurements and model simulation. (A) Simulated responses of binocular summation neurons. Blue curves, averaged neural responses aligned to the peak of the response of one of the binocular summation neurons. Black curves, averaged response of the other neuron in the same time window. Rivalry indices are computed by dividing the amplitude of the rival signal (black curve) by the amplitude of the corresponding aligned signal (blue curve). Light-gray bar, attended. Dark-gray bar, unattended. (B) Empirical results measured with EEG (replotted from ref. 14).

