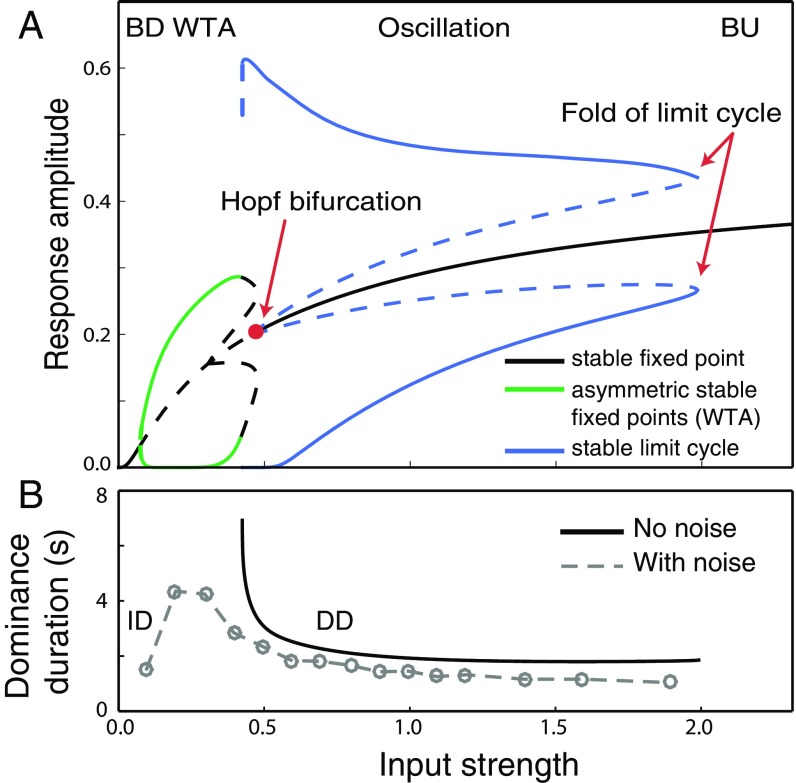
Fig. 5.
(A) Levelt’s proposition IV. The bifurcation diagram shows the response amplitude of binocular summation neurons as a function of input stimulus strength. Black solid curve, equal-activity regime [both-down (BD) and both-up (BU) regimes] in which the two summation neurons responded equally. Blue solid curves, stable oscillatory regime, in which the simulated neurons exhibited response alternations. Each neuron can be dominant (top branch) or suppressed (bottom branch) for a period, after which the responses of the two neurons alternate. Green solid curves, winner-take-all (WTA) regime, in which one of the two binocular summation neurons dominated with no alternations. Each neuron can be dominant (top branch) or suppressed (bottom branch) indefinitely, depending on the initial condition. Dashed curves, unstable (and physically unrealizable) solution states. (B) Black solid curve, dominance duration of the oscillation as a function of input strength. Gray dashed curve, simulated dominance duration in the presence of noise. ID (increasing duration), a regime in which dominance duration increases with input strength. DD (decreasing duration), a regime in which dominance duration decreases with input stimulus strength.

