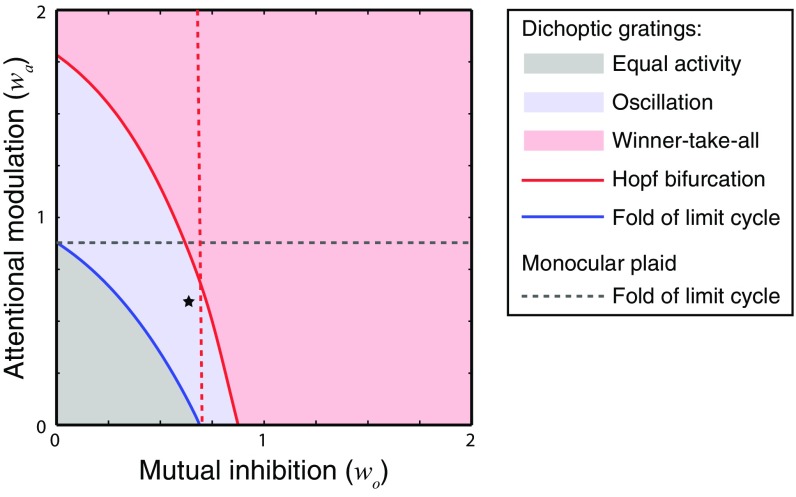
Fig. 6.
Bifurcation analysis as a function of the attentional modulation (wa) and the mutual inhibition (wo), with fixed input strength (D = 0.5). All of the elements in the figure depict the model behavior for dichoptic gratings, except the gray dashed lines. The areas in three different colors represent three regimes: equal activity, oscillation, and winner-take-all. Solid curves, boundaries between the different regimes. The red dashed line is positioned where the blue curve intersects the x axis. Left of this boundary, rivalry is absent when attention is diverted (wa = 0). The gray dashed line indicates the boundary of the oscillatory regime (i.e., response alternations) for monocular and binocular plaids. For values of wa above this curve, the model exhibits response alternations with plaids. Black star, parameters used for simulations in Figs. 2–5.

