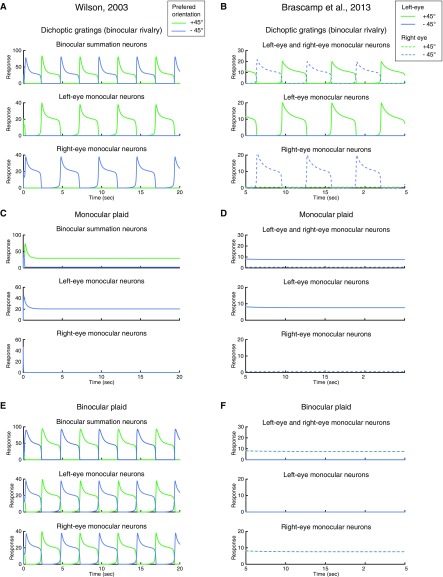
Fig. S6.
(A, C, and E) Wilson’s model. Reprinted with permission from ref. 4. Simulations of three conditions: (A) Dichoptic gratings, conventional binocular rivalry. (C) Monocular plaid. In the middle row (left-eye monocular neurons), the two neurons selective for orthogonal orientations have the same response amplitude, and thus the green and blue curves overlap. (E) Binocular plaid. (B, D, and F) Brascamp et al.’s model. Reprinted with permission from ref. 33. Simulations of three conditions: (B) Dichoptic gratings, conventional binocular rivalry. (D) Monocular plaid. Here, the two left-eye monocular neurons selective for orthogonal orientations have the same response amplitude, and thus the solid green curve and the solid blue curve overlap. (F) Binocular plaid. Here, the two right-eye monocular neurons selective for orthogonal orientations have the same response amplitude, and thus the dashed green curve and the dashed blue curve overlap. The left-eye monocular neurons are suppressed throughout the simulation.

