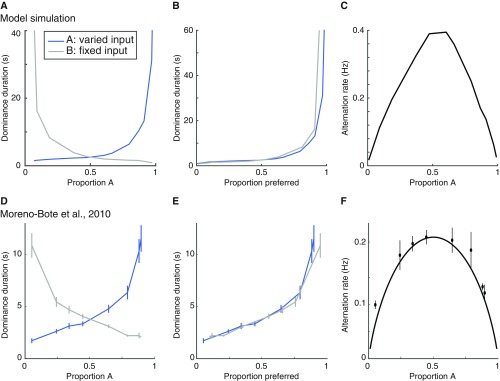
Fig. S7.
Levelt’s propositions I–III. (A) Dominance duration as a function of input stimulus strength. The strength of input B is fixed while input A is varied. Following ref. 10, we transformed the unit of the input strength of stimulus A to “Proportion A,” which was computed as follows: mean dominance duration A/(mean dominance duration A + mean dominance duration B). Blue curve, dominance duration of stimulus A, is the average period for which stimulus A is dominant. Gray curve, dominance duration of stimulus B. (B) Same as A, except that the gray curve is flipped vertically about the equidominance point (Proportion A = 0.5). (C) Alternation rate is highest when A and B have equal strength. (D–F) Empirical results replotted from ref. 10. The simulations for A–C are performed in the presence of neural noise (see SI Levelt’s Proposition and Methods, Noise).

