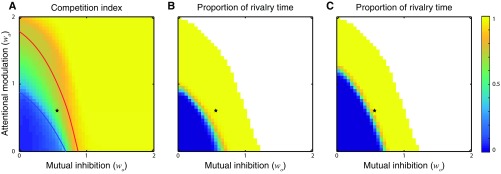
Fig. S8.
Effect of noise on system behavior. See SI Effect of Noise on Model Behavior for the details of the simulation with noise. (A) Competition index as a function of the attentional modulation (wa) and the mutual inhibition (wo), with fixed input strength (D = 0.5) and noise. The red and blue curves, copied from Fig. 6, were identified by bifurcation analysis of the noise-free system. Blue curve, boundary representing transitions from equal activity to oscillation. Red curve, boundary representing transitions from oscillation to WTA. (B) Proportion of time that rivalry was observed in the entire simulation (10-min duration). (C) Same as B, but with different criteria for defining rivalry responses (SI Effect of Noise on Model Behavior). In B and C, the parameter values at which one binocular summation neuron dominated over the other for the entire simulation were colored as white, representing WTA behavior. Black star, parameters used for simulations in Figs. 2–5.

