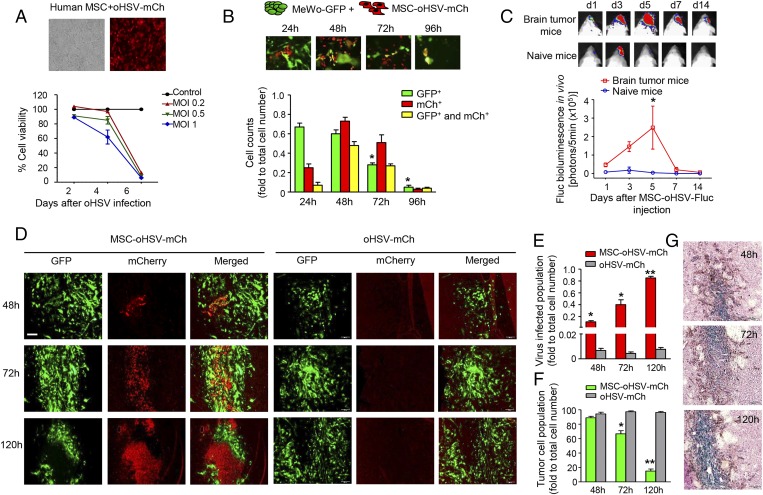
Fig. 3.
In vivo imaging of MSC-mediated delivery of oHSV in mouse models of melanoma brain metastasis. (A) Cell viability of MSCs infected with oHSV-mCh at the indicated MOI analyzed at days 2, 4, and 6 postinfection. Representative phase and fluorescent images of human MSCs infected with oHSV-mCh at an MOI of 1 (24 h postinfection) are shown. (Magnification: 10×.) (B) MSC-oHSV-mCh were cocultured with MeWo-GFP at a 1:1 ratio, and populations of tumor cells (green), oHSV-mCh loaded MSCs (red), and oHSV-mCh–infected tumor cells (yellow) were analyzed at different time points. Representative fluorescent images show the coculture of MeWo-GFP and MSC-oHSV-mCh over time. (Magnification: 20×.) (C) Plot showing Fluc activity after MSC-oHSV-Fluc ICA injection in the melanoma metastatic brain tumor mice group and naive mice group. Representative bioluminescent images at different time points are shown. *P < 0.05 vs. naive mice (n = 3 mice per group). (D) Fluorescent images showing the population of tumor cells (GFP+) and oHSV-mCh–infected cells (mCh+) after ICA injection of MSC-oHSV-mCh or purified oHSV-mCh at the indicated time points. (Scale bar: 100 µm.) (E and F) Plots showing the populations of oHSV-mCh–infected cells (E) and tumor cells only (F) in the brain at different time points after ICA injection of MSC-oHSV-mCh or purified oHSV-mCh. *P < 0.05, **P < 0.01 vs. the oHSV-mCh–injected group (n = 3 mice per group). (G) Photomicrographs showing the time-dependent increase in LacZ+-infected cells after ICA injection of MSC-oHSV-mCh. (Magnification: 10×.)

