Fig. 5.
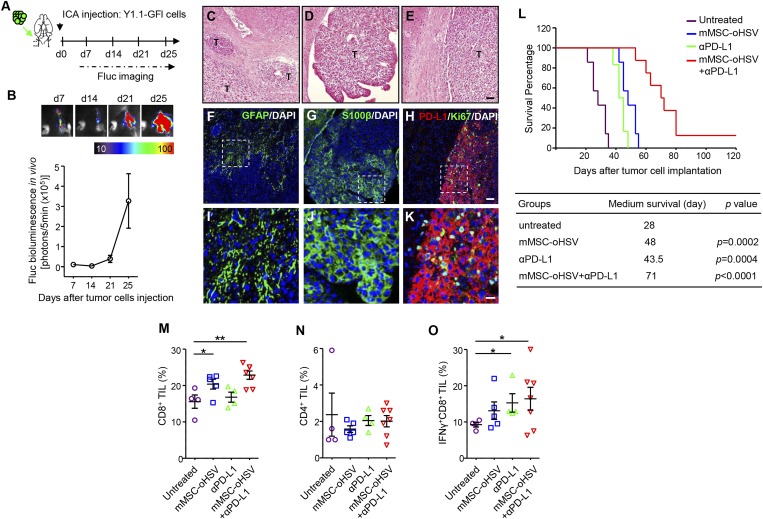
Combined therapeutic efficacy of mouse MSC-oHSV and αPD-L1 in a syngeneic mouse model of melanoma brain metastasis. (A) Experimental outline. Green arrow indicates the route of tumor cell injection. Black arrow indicates the time point for tumor implantation. (B, Top) Representative bioluminescent images showing mice ICA-injected with Y1.1-GFl cells. (B, Bottom) Plot showing the in vivo bioluminescence intensity of metastatic tumor growth in the syngeneic mouse model (n = 5 mice). (C–E) H&E histology images showing multiple metastatic foci present in the brains of mice bearing melanoma brain metastases. T, tumor area. (Scale bar: 50 µm.) (F–K) Immunofluorescence analysis of mouse GFAP, S100β, PD-L1, and Ki67 in adjacent brain sections of mice bearing melanoma brain metastases (Scale bars: 50 µm in F–H, 20 µm in I–K). Nuclei were stained with DAPI. (L) Kaplan–Meier survival curves of melanoma brain metastasis-bearing mice treated with mMSC-oHSV (n = 7 mice), αPD-L1 (n = 6 mice), mMSC-oHSV + αPD-L1 (n = 8 mice), or untreated (n = 7 mice). The table presents the medium survival for each group and a comparison of the treated and untreated control groups (log-rank test). (M–O) Proportion of indicated cell populations determined by flow cytometry. Bars indicate mean values and SE. *P < 0.05, **P < 0.01 vs. untreated controls.

