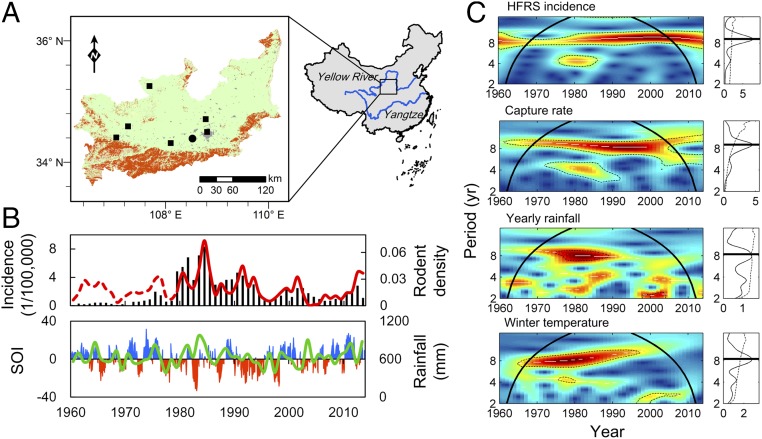
Fig. 1.
Time series of climatic, surveillance, and epidemiological data. (A) Map of the Weihe Plain in Central China (106–110 °E, 34–36 °N), showing the weather station (rectangles) and sampling sites (circle; Hu County), croplands (green), artificial surfaces (gray), and areas overlapping the massif (orange). Since 1980, field surveillance of rodent dynamics has been carried out monthly. (B) The annual time series of HFRS incidence (bars) between 1960 and 2013, A. agrarius population density (red line), and the reconstructed population (Materials and Methods) density (dashed line) as provided by the optimal model. Rainfall (green line) and the Nino3.4 index, which serves as a proxy for ENSO (blue bars represent La Niña and red bars represent El Niño), are also shown. (C) Wavelet power spectra of the annual time series showing the periodicity of the incidence of HFRS, capture rate of striped field mouse, rainfall, and winter temperature. Wavelet power spectra are depicted in C, Left, and global wavelet power spectra are in C, Right. In the wavelet power spectra, the dotted line corresponds to the 5% significance level, and the bold line is known as the cone of influence. This line delimits the effect of the treatment of the boundaries. The white lines materialize the maxima of the undulations of the wavelet power spectra, and the colors code for power values from blue (low values) to red (high values). C, Right shows the mean spectrum (vertical solid black line) with its significant threshold value of 5% (dashed line).

