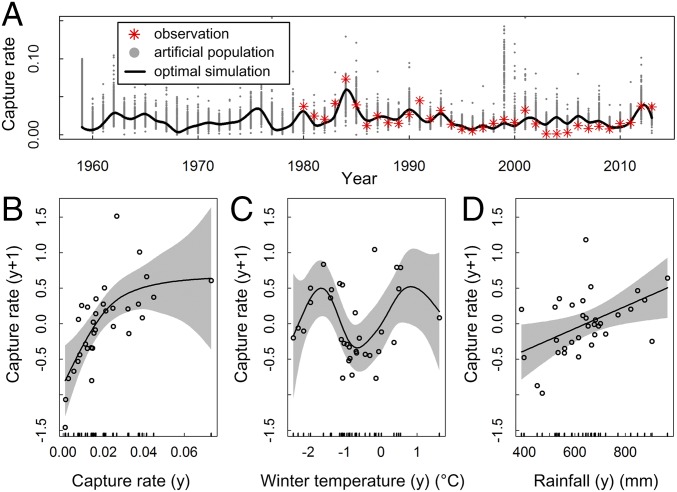
Fig. 2.
The results of generalized additive models for A. agrarius. (A) Rodent population dynamics. Shown are 1,000 rodent population runs of the stochastic model in Eq. 1; the gray points show all artificial populations simulated, the red points are the annually observed rodent populations, and the black line indicates the result of the optimal model (R = 0.81). (B–D) Partial effects of the annual density (B), last winter temperature (C), and rainfall (D). Shaded areas are 95% confidence bands. Winter temperature is calculated from December to January.

