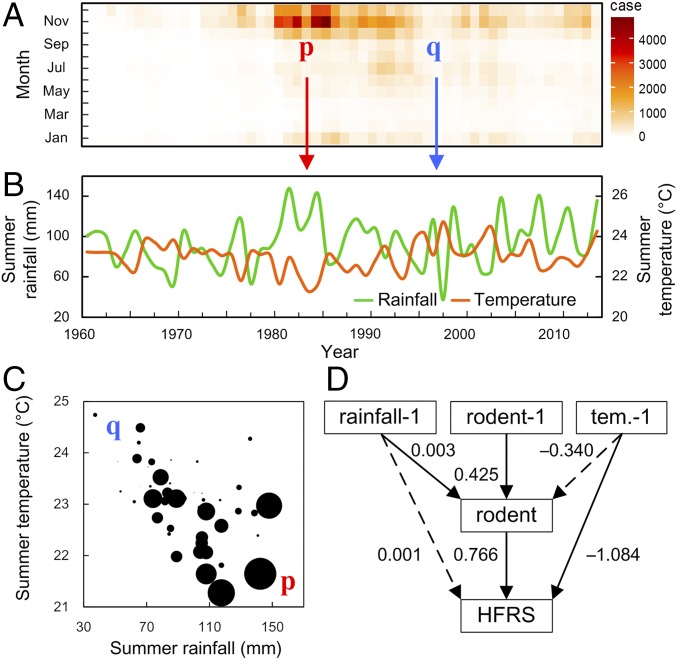
Fig. 3.
Time series of monthly HFRS cases, summer rainfall, and the summer temperatures in the Weihe Plain, during the past 54 y. (A) Monthly distribution of HFRS cases. The number of HFRS cases (x axis, time in year; y axis, month in year) ranges from a low value (in white) to a high value (in dark red). (B) Summer rainfall (green line) and summer temperature (orange line). (C) Scatterplot of summer temperature (negatively associated with HFRS cases, R = −0.48, P < 0.01), summer rainfall (positively associated with HFRS cases, R = 0.35, P < 0.01), and HFRS cases (circle size is proportionate to the number of HFRS cases). p (red) and q (blue) represent zoonotic outbreaks and nonoutbreaks with corresponding summer climate conditions, respectively. Summer climate conditions are calculated from May to September. (D) Structure and results from our structural equation models for climate-linked HFRS epidemics. Values associated with arrows represent standardized path coefficients. The dashed lines represent nonsignificant paths; −1, previous year; rainfall, total annual rainfall; tem., mean annual temperature.

