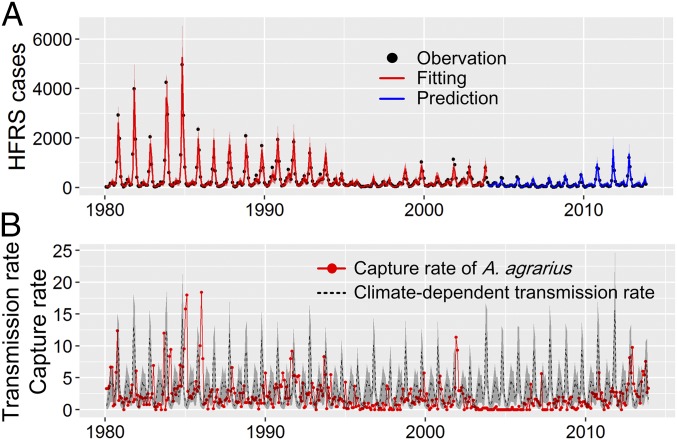
Fig. 4.
Results of the nonlinear disease transmission model. (A) Temporal dynamics of observed vs. predicted HFRS cases. HFRS cases from rodent population models derived from data from 1980 to 2003. Observations are in black, fitted values are in red, and predictions for 2004–2013 are in blue. (B) The rodent population density and climate-dependent transmission rate; the corresponding shaded areas indicate the 95% credible intervals of the model fit.

