Fig. 3.
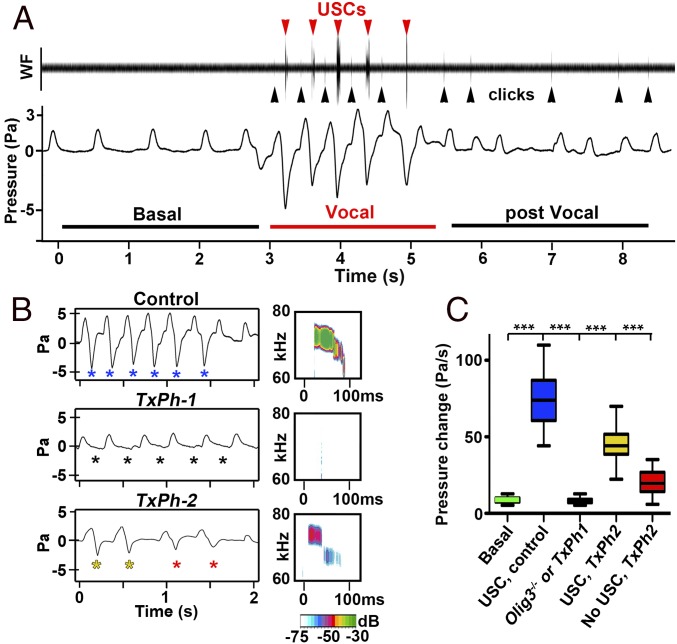
Vocal breathing behavior in newborn mice. (A) Waveform and plethysmographic traces illustrating slow basal and fast vocal breathing episodes in control mice. Red and black arrowheads point to USCs and clicks, respectively. (B, Left) Plethysmographic recordings of fast breathing episodes in control, TxPh-1, and TxPh-2 mice. Blue asterisks indicate expirations of control mice that produced USCs. Black asterisks indicate expirations of TxPh-1 mice that produce no USCs. Red and yellow asterisks indicate expirations of TxPh-2 mice that produced no calls or weak calls, respectively. (B, Right) spectrograms from control, TxPh-1, and TxPh-2 mice. Note that only clicks were observed in TxPh-1 mice. Sound intensity (in dB) is color-coded. (C) Boxplots of expiratory pressure changes during vocal breathing. Pressure changes observed in basal expirations and vocal expirations of control (n = 9) mice are shown in green and blue, respectively. Pressure changes during fast breathing episodes of Olig3−/− (n = 4) and TxPh-1 (n = 14) mice are shown in black. Pressure changes that were/were not associated with USCs in TxPh-2 mice (n = 7) are shown in yellow and red, respectively. ***P < 0.0001.

