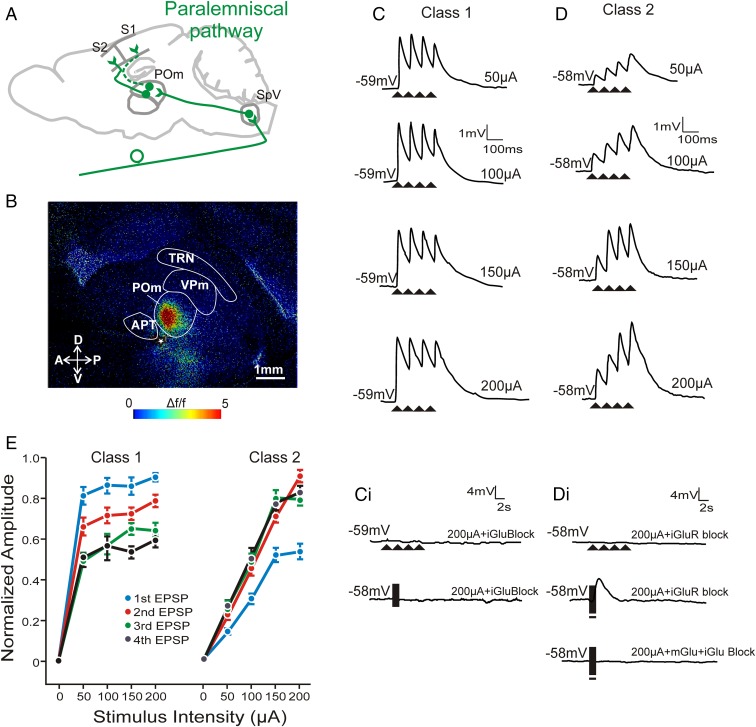
Fig. 2.
Electrical stimulation of the paralemniscal pathway shows both class 1 and 2 properties in POm synapses. (A) Schematic of the paralemniscal pathway from brainstem SpV to S1 and S2 via POm. (B) FA image showing selective activation of POm to electrical stimulation of fibers in the paralemniscal pathway from brainstem (white star, 50 µA). (C) Example EPSP traces of a POm cell in response to 10 Hz electrical stimulation at increasing intensities. Paired-pulse depression is observed, a class 1 property. (C, i) Traces from the same cell during high-intensity stimulation at 10 Hz (upper trace) and high-frequency stimulation (lower trace) in the presence of ionotropic glutamate receptor blockers. (D) Example EPSP traces of a POm cell in response to 10 Hz stimulation with paired-pulse facilitation, a class 2 property. (D, i) Traces from the same cell during high-intensity stimulation at 10 Hz (upper trace) and high-frequency stimulation (middle trace) in the presence of ionotropic glutamate receptor blockers. Note the prolonged membrane depolarization during high-frequency stimulation (middle trace) could be abolished by metabotropic receptor antagonists (bottom trace). (E) Normalized EPSP response amplitudes as stimulation intensity increases for both classes. EPSPs were normalized to the EPSP amplitude that was the highest response at any stimulation intensity within each class. In contrast to cells showing a class 1 response (n = 11), class 2 cells (n = 28) showed EPSP amplitudes that increased dependent on stimulation intensity. Error bars represent mean ± SEM. APT, anterior pretectal nucleus; POm, posterior medial nucleus; SpV, spinal trigeminal nucleus; TRN, thalamic reticular nucleus; VPm, ventral posterior medial nucleus.

