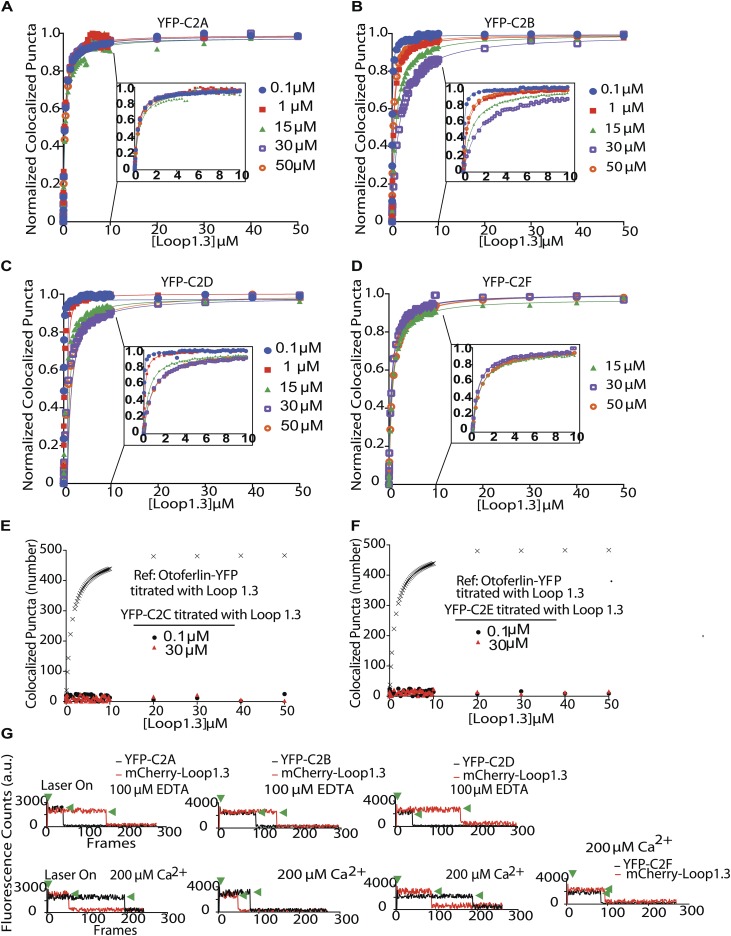
Fig. S5.
Multiple C2 domains mediate otoferlin–Loop1.3 interaction. Binding curves for YFP-otoferlin C2A (A), C2B (B), C2D (C), and C2F (D) domains titrated with Loop1.3 at indicated calcium concentrations. Insets in A–D depict 0–10 µM for clarity. Each experimental data point represents the mean value of n = 3 sample preparations. (E and F) Dose–response for immobilized YFP-C2C and YFP-C2E I titrated with Loop1.3 in the presence of 0.1 or 30 μM calcium (n = 3). Colocalization between Loop1.3 and YFP-otoferlin is included for comparison. (G) Representative single-molecule photobleaching traces for Loop1.3 bound to YFP-otoferlin C2A, C2B, C2D, and C2F domains in the presence of 100 μM EDTA (Top) or 200 μM free calcium (Bottom).

