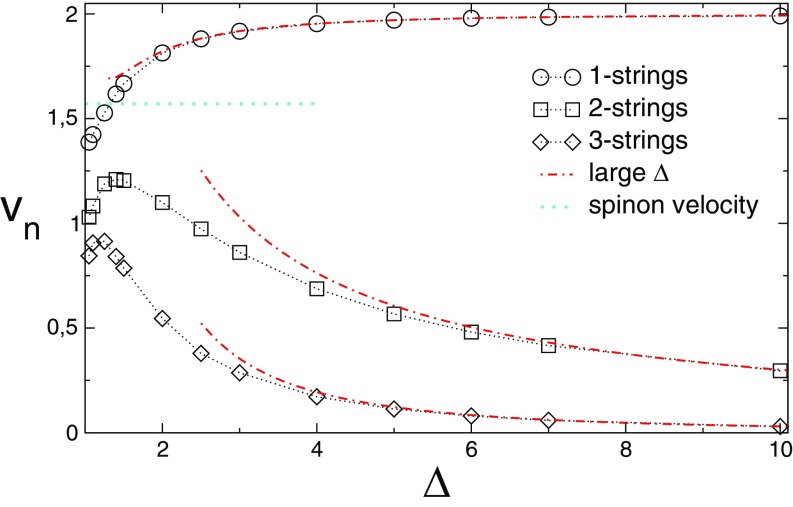
Fig. S3.
Group velocities of the low-lying excitations around the steady state after the quench from the Néel state in the chain. The maximum velocity in each string sector (different symbols used in the figure) is plotted against the anisotropy . The dashed–dotted lines are the analytical results of Eq. S14 in the large limit. The horizontal dotted line is the (low-energy) spin-wave velocity at .

