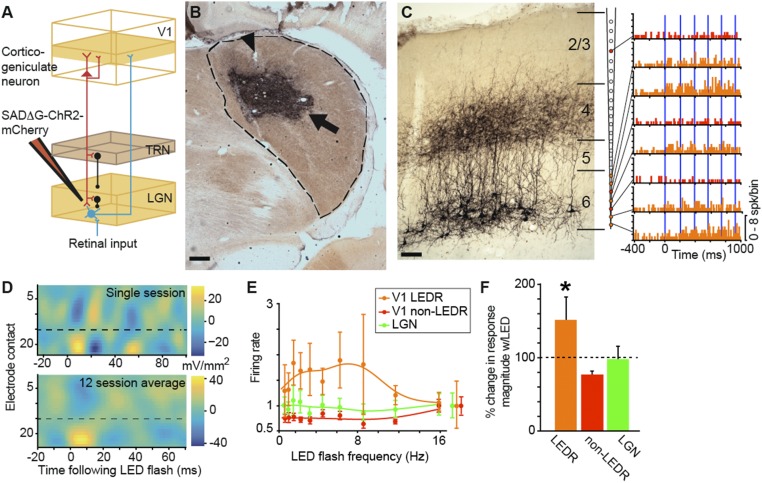
Fig. 1.
Virus injection and LED stimulation of putative CG neurons. (A) Schematic representation of the CG feedback circuit and injection of SAD∆G-ChR2-mCherry into the LGN, resulting in retrograde labeling of CG neurons (red). Feedforward projections (retinal axons and LGN relay neurons) are in cyan; inhibitory interneurons (from TRN and within the LGN) are in black. (B) Coronal section through the LGN (dashed line) illustrating the virus injection zone (arrow) and electrode lesions (arrowhead). Dorsal is up, medial is left. (Scale bar, 375 μm.) See SI Appendix, Fig. S1 A and B for additional examples. (C, Left) Coronal section through V1 (area 17) illustrating CG neurons expressing mCherry. (Scale bar, 250 μm.) Cortical layers are indicated by horizontal lines and labeled. (C, Right) Lines connect peristimulus-time histograms to recording contacts on the schematic linear array (orange and red PSTHs indicate LEDR and non-LEDR neurons, respectively). Blue lines indicate 5-ms LED flashes. Note that all LEDR neurons are located on deep contacts (orange-filled circles on the array). (D) Current-source density profiles of local field potential responses to LED-only stimulation for a single session (Top) and averaged across 12 sessions (Bottom). Low-number electrode contacts are closest to the pial surface; dashed lines indicate the border between layers 4 and 5. (E) Population LED tuning curves for 15 V1 LEDR neurons (orange), 19 V1 non-LEDR neurons (red; within 147 μm of LEDR neurons), and 21 LGN neurons (green). Normalized spontaneous activity levels for each neuron type are indicated to the right of the curves. Error bars represent SEMs. (F) Percent change in response magnitude relative to spontaneous activity levels (indicated by the dashed line) with LED-only stimulation for V1 LEDR neurons (n = 15; orange; average change in LEDR response magnitude is 152 ± 31%), neighboring V1 non-LEDR neurons within 147 μm on average of LEDR neurons (n = 19; red; average change in non-LEDR response magnitude is 77 ± 5%), and LGN neurons (n = 21; green; average change in LGN response magnitude is 98 ± 17.3%). Error bars represent SEMs, and the asterisk indicates that the LED significantly enhanced the magnitude of V1 LEDR neuronal responses compared with other V1 and LGN neurons, which were not modulated (P = 0.0002). spk, spike; w/, with.

