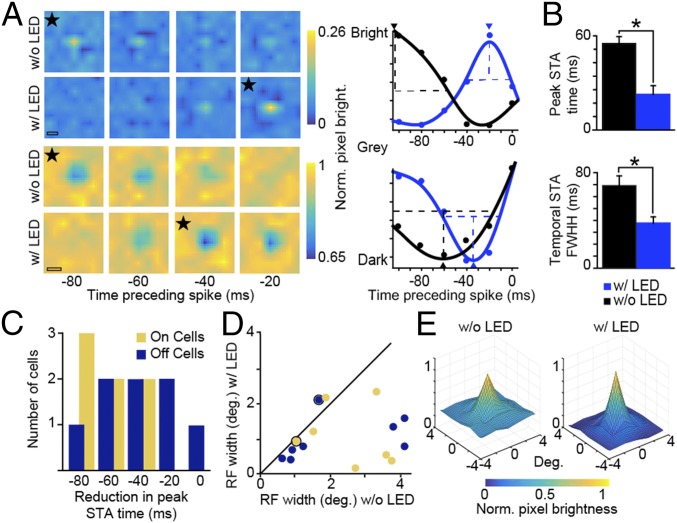
Fig. 2.
LED stimulation of CG feedback reduces spatiotemporal response latency and full width at half height. (A, Left) Spike-triggered averages for representative LGN ON (Top two rows) and OFF (Bottom two rows) neurons with and without LED stimulation. Stars identify frames with peak pixel brightness; the interior height of the scale bars illustrates the width of each pixel in the grid; and the color bars illustrate pixel brightness values. (Scale bars, 2.5°.) (A, Right) Temporal STA curves (Gaussian fits to data, indicated by dots) for the same neurons without (black) and with (blue) LED stimulation. Arrowheads show temporal STA peaks; dashed lines show full width at half height (FWHH; cutoff for without LED response). (B) Average peak STA time (absolute values used) and FWHH of temporal STA without (black) and with (blue) LED stimulation for 15 LGN neurons. Error bars represent SEMs; asterisks indicate statistically significant differences at P ≤ 0.01. (C) Histogram of reduction in peak STA time with LED stimulation for LGN ON (gold; n = 7) and OFF (dark blue; n = 8) neurons. (D) Comparisons of classical receptive field (RF) width (degrees) for ON (gold; n = 7) and OFF (dark blue; n = 8 neurons from six experimental animals) LGN neurons with and without LED stimulation. Dots with black rings indicate the ON and OFF neurons illustrated in A. (E) Aggregate receptive fields for the 15 LGN neurons illustrated in C and D (OFF neuronal response polarities were flipped) without (Left) and with (Right) LED stimulation of CG feedback. y axes are normalized pixel brightness as indicated by the color bar beneath. Individual neuronal spatial receptive fields were scaled according to the without-LED response and averaged together to generate aggregate receptive fields. bright, brightness; deg, degrees; Norm, normalized; w/, with; w/o, without.

