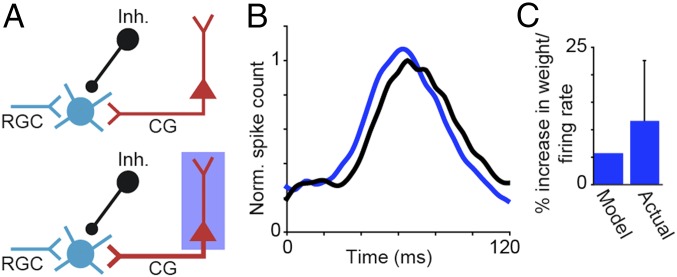
Fig. 4.
Model simulation of CG impact on LGN onset response latency. (A) Schematics of model inputs to LGN relay neuron: retinal (RGC; cyan), CG (red), and inhibitory (Inh.; black). (A, Upper) Schematic illustration of visual stimulation alone. (A, Bottom) Schematic illustration of visual plus LED stimulation (the thicker CG axon indicates increased CG weight with LED stimulation; blue box). (B) Average LGN PSTHs in response to grating stimuli with (blue) and without (black) LED stimulation of CG feedback. (C) Histogram of model and actual increases in CG weight/firing rate with LED stimulation. Error bar represents SEM. Norm, normalized.

