Fig. 3.
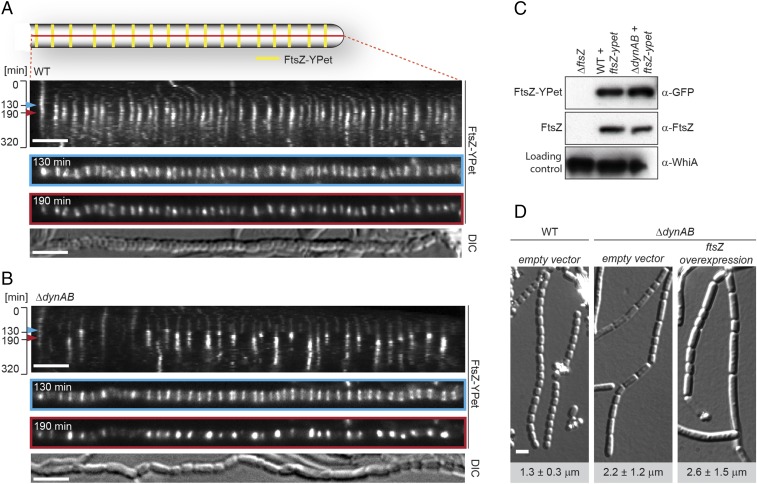
DynA and DynB stabilize Z-rings during sporulation-specific cell division. Kymograph analysis of FtsZ-YPet dynamics during sporulation-specific cell division in WT (A) and ΔdynAB cells (B), expressing an additional copy of ftsZ-ypet (strains SS12 and SS14). Blue and red arrowheads denote time points of initial Z-ring assembly (130 min) and maturation (190 min), shown in separate images below. Differential interference contrast (DIC) images show the corresponding spore chain at the end of cell division. Additional kymographs can be found in Fig. S4. (Scale bars: 4 μm.) (C) Immunoblot analysis showing FtsZ and FtsZ-YPet levels in WT (SS12), ΔdynAB (SS14), and ΔftsZ cells. Equal protein concentrations of crude cell lysate were loaded for each lane and samples were probed with anti-FtsZ, anti-GFP, and anti-WhiA antibodies. WhiA is a transcriptional regulator that is present at constant levels throughout the developmental life cycle (42) and was used as a loading control. (D) DIC images of sporulating WT and ΔdynAB hyphae carrying the empty vector (SS4, SS10) or ΔdynAB hyphae constitutively expressing ftsZ from the ermE* promoter (SS11). Numbers indicate mean spore lengths ± SD (n > 460 spores per strain). (Scale bar: 2 μm.)

