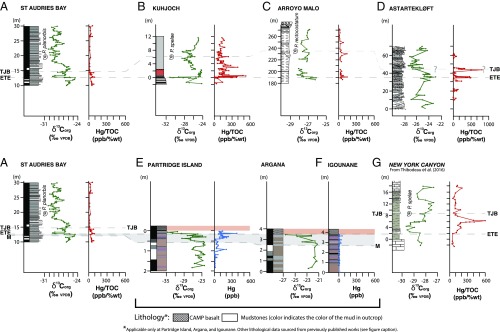
Fig. 3.
Comparison of Hg/TOC data from St Audries Bay, Kuhjoch, Arroyo Malo, Astartekløft, and New York Canyon (35), and Hg data from Partridge Island and Iguonane (where TOC contents were below error). Letters next to locations refer to letters on the map in Fig. 2A. Carbon isotope data, biostratigraphy (ammonite first appearance), lithology, and magnetostratigraphy are also shown to allow stratigraphic correlation of the end-Triassic extinction (ETE) horizon and Triassic–Jurassic boundary (TJB). Lithological data are from St Audries Bay (10), Kuhjoch (11), Arroyo Malo (54), Astartekløft (10), Partridge Island (this study; shown in figure), Argana (14), Igouane (this study; shown in figure), and New York Canyon (35). Carbon isotope and biostratigraphic data are from St Audries Bay (10, 50), Kuhjoch (11), Arroyo Malo (ref. 54 and this study), Astartekløft (10), Partridge Island (this study), Argana (14), and New York Canyon (35). Line M indicates the magnetostratigraphic correlation, below the extinction horizon, between St Audries Bay, Partridge Island, Argana, and Igounane. The gray shading illustrates the stratigraphic gap between line M and line ETE. Magnetostratigraphic data are from St Audries Bay (52, 53), Partridge Island (55), and Argana (14). Note, for Astartekløft, the expanded horizontal scale, and the gaps in data due to sand beds with negligible TOC. Full δ13Corg, Hg, TOC, and Hg/TOC data for each individual section are reported in SI Appendix, Table S3 and Fig. S4.

