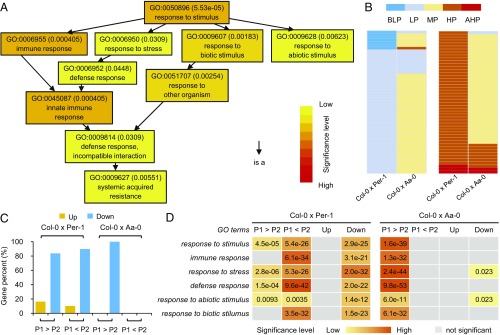
Fig. 4.
Distinct expression patterns of stimulus-responsive genes between Col-0 × Per-1 and Col-0 × Aa-0. (A) GO analysis of 453 candidate genes for biomass heterosis, which were significantly enriched in response to stimuli. (B) Candidate genes exhibiting low-parent expression (LP) or below–low-parent expression (BLP) and high-parent expression (HP) or above–high-parent expression (AHP) in Col-0 × Per-1 largely show middle-parent expression (MP) in Col-0 × Aa-0. (C) Genome-wide comparison of expression patterns between Col-0 × Per-1 and Col-0 × Aa-0. P1 in Col-0 × Per-1 and Col-0 × Aa-0 represents Col-0; P2 in Col-0 × Per-1 and Col-0 × Aa-0 represents Per-1 and Aa-0, respectively. Up, up-regulation in hybrid; Down, down-regulation in hybrid. (D) GO analysis of genes with expression variation in Col-0 × Per-1 and Col-0 × Aa-0.

