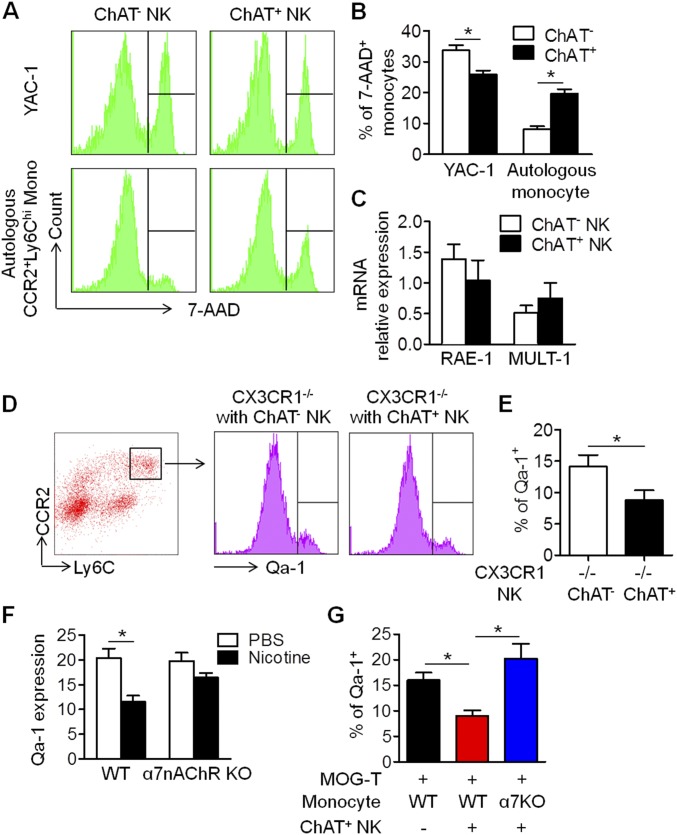
Fig. S4.
Cytotoxicity of ChAT+ NK cells toward autologous CCR2+Ly6Chi monocytes was modulated through regulation of Qa-1. (A) ChAT+ NK cells and ChAT− NK cells were isolated from EAE mice at 7 dpi. The indicated NK cells were cocultured with YAC-1 cells or autologous NK cells at the effector:target ratio of 10:1. The specific lysis rate toward target cells was identified by 7-AAD staining. (B) The ability of ChAT− NK cells to lyse YAC-1 cells exceeded that of ChAT+ NK cells (33.7 ± 1.62% vs. 25.93 ± 1.21%; P < 0.05). In coculture with autologous CCR2+Ly6Chi monocytes, the susceptibility to lysis by ChAT+ NK cells was higher than that by ChAT− NK cells (19.62 ± 1.47% vs. 8.23 ± 0.90%; P < 0.05). (C) The mRNA expression of RAE-1 and MULT-1 on CCR2+Ly6Chi monocytes/macrophages was not altered significantly after coculture with ChAT+ NK cells (1.39 ± 0.24 vs. 1.04 ± 0.33 and 0.51 ± 0.12 vs. 0.75 ± 0.25 relative expression for RAE-1 and MULT-1 after coculture with ChAT− vs. ChAT+ cells, respectively; P > 0.05). n = 6 per group from three independent experiments. (D and E) The expression of Qa-1 in CNS-infiltrating CCR2+Ly6Chi monocytes was down-regulated by ChAT+ NK cell implantation (14.15 ± 1.82% vs. 8.78 ± 1.60% for Qa-1 expression in CX3CR1−/− with ChAT−/ChAT+ NK cell implantation). n = 6 per group from three independent experiments. (F) The expression of Qa-1 on CCR2+Ly6Chi monocytes/macrophages was decreased significantly by nicotine treatment in culture (20.35 ± 1.94% vs. 11.60 ± 1.18% for PBS vs. nicotine; P < 0.05) but only slightly decreased in α7nAChR KO cells (9.78 ± 1.70% vs. 16.48 ± 0.89% for PBS vs. nicotine; P = 0.057). n = 6 per group from three independent experiments. (G) Qa-1 expression in EAE mice adoptively transferred with MOG-responsive T cells and CCR2+Ly6Chi monocytes was down-regulated by ChAT+ NK cell implantation (16.0 ± 1.47% vs. 9.0 ± 1.08%; P < 0.05), which was reversed in α7nAChR KO CCR2+Ly6Chi monocytes (9.0 ± 1.08% vs. 20.25 ± 2.84%; P < 0.05). n = 6 per group from three independent experiments. Mean ± SEM. *P < 0.05.

