Fig. S5.
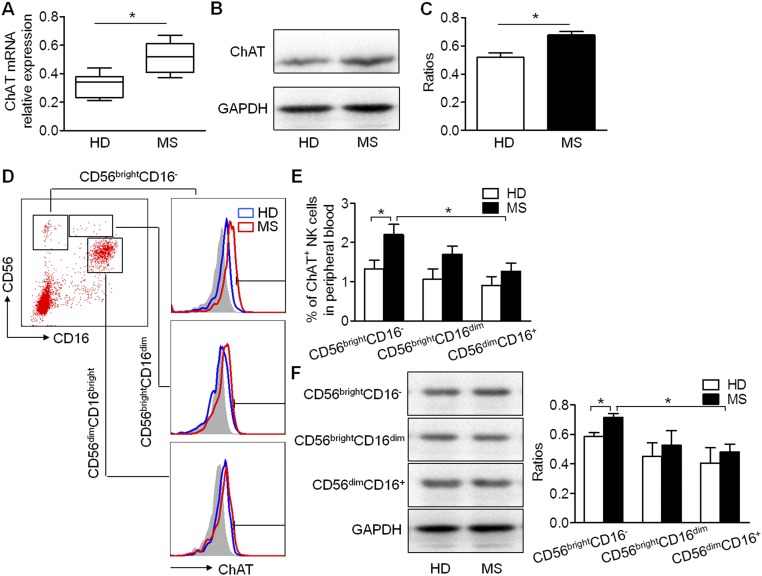
Up-regulation of ChAT expression in NK cells of MS patients, especially in the CD56brightCD16− subset of NK cells. (A) mRNA relative expression of ChAT in NK cells from MS patients was higher than that of healthy individuals (HDs) (0.32 ± 0.03 vs. 0.52 ± 0.04 relative expression; P < 0.05). n = 6 per group. (B and C) ChAT expression increased in MS patients. The relative protein expression was determined by Western blot analysis (0.52 ± 0.03 vs. 0.68 ± 0.02 relative expression; P < 0.05). n = 6 per group. (D) Subsets of NK cells from the peripheral blood of HDs or MS patients were gated based on CD56 and CD16 expression. ChAT expression was further analyzed on CD56brightCD16−, CD56brightCD16dim, and CD56dimCD16+ NK cells, with proper isotype controls involved. (E) No significant differences of ChAT expression were observed among subsets of NK cells in HDs. However, a higher level of ChAT was detected in the CD56brightCD16− subset of NK cells from MS patients than in HDs (1.33 ± 0.22% vs. 2.2 ± 0.26%; P < 0.05), and this level was also higher than in the CD56dimCD16+ subset of MS patients (1.27 ± 0.20% vs. 2.2 ± 0.26%; P < 0.05). The ChAT expression in CD56brightCD16dim and CD56dimCD16+ NK cells tended to increase slightly more in MS patients than in HD donors (1.07 ± 0.26% vs. 1.70 ± 0.21% and 0.9 ± 0.23% vs. 1.27 ± 0.20% for ChAT expression in HD vs. MS among CD56brightCD16dim and CD56dimCD16+ NK cells, respectively; P > 0.05). n = 12 per group. (F) ChAT expression in subsets of NK cells from MS patients and HDs was also confirmed by Western blot analysis (relative ratios of 0.59 ± 0.03 vs. 0.71 ± 0.03, 0.45 ± 0.09 vs. 0.53 ± 0.10, and 0.41 ± 0.10 vs. 0.48 ± 0.05 for ChAT expression in HD vs. MS in the above-mentioned subsets, respectively), with GAPDH as the internal standard. Images are representative of three independent experiments. n = 6 per group. Mean ± SEM. *P < 0.05.

